A pan-cancer bioinformatic analysis of the carcinogenic role of SMARCA1 in human carcinomas
Abstract
SMARCA1is a mammalian imitation switch (ISWI) gene that encodes for SNF2L. SNF2L is involved in regulating cell transition from a committed progenitor state to a differentiated state. Although many papers have detailed the correlation between SMARCA1 and different cancers, no pan-cancer analysis has been conducted to date. We started by exploring the potential carcinogenic role of SMARCA1 across 33 carcinomas using the cancer genome atlas (TCGA) and the genotype-tissue expression (GTEx) databases. The expression of SMARCA1 was significantly elevated in some tumor types but not in others. There was a distinct relationship between SMARCA1 expression and patient prognosis. S116 phosphorylation levels were up-regulated in both lung adenocarcinoma and uterine corpus endometrial carcinoma. The expression level of SMARCA1 was positively correlated with cancer-associated fibroblasts infiltration in a number of tumors, such as colon adenocarcinoma, cervical squamous cell carcinoma and endocervical adenocarcinoma. It was also associated with CD8+ T-cell infiltration in head and neck squamous cell carcinoma and lung adenocarcinoma. Furthermore, SMARCA1 is involved in chromatin remodeling and protein processing-associated mechanisms. Our study presents an initial assessment and illustration of the carcinogenic role of SMARCA1 in different carcinomas.
Affiliations: Department of Hepatopancreatobiliary Surgery, Ningbo Medical Centre Lihuili Hospital, Ningbo University, Ningbo, Zhejiang, China; Tongji Hospital of Tongji Medical College, Huazhong University of Science and Technology, Wuhan, Hubei, China
License: © 2022 Dai et al CC BY 4.0 This is an open access article distributed under the terms of the Creative Commons Attribution License, which permits unrestricted use, distribution, and reproduction in any medium, provided the original author and source are credited.
Article links: DOI: 10.1371/journal.pone.0274823 | PubMed: 36126083 | PMC: PMC9488775
Relevance: Moderate: mentioned 3+ times in text
Full text: PDF (38 KB)
1. Introduction
Oncogenesis and tumor progression mechanisms are very complex and involve many different genes. It is therefore essential to perform pan-cancer analysis of the involved genes to investigate any potential relationship between the mechanisms and patient prognosis. The cancer genome atlas (TCGA) project, the genotype-tissue expression (GTEx) and the Oncomine databases are three publicly accessible databases that provide an extensive collection of tumor-related functional genomics datasets [ref. 1–ref. 5] for researchers to carry out a pan-cancer analysis.
SWI/SNF-related, matrix-associated, actin-dependent regulator of chromatin, subfamily A, member 1 (SMARCA1) protein is an important subunit of the SWI/SNF complex involved in chromatin remodeling and transcriptional activation [ref. 6, ref. 7]. The structure and function of SMARCA1 have been partially explored from an epigenetic and clinicopathological perspective [ref. 6–ref. 11]. Although the SMARCA1 protein has only been partially mapped, five conserved domains have been identified which are: DNA-binding domain (DBINO), HAND domain, SLIDE domain, Helicase superfamily c-terminal domain (HELICc) as well as the ’SWI3, ADA2, N-CoR and TFIIIB’ DNA-binding domains (SANT) [ref. 12–ref. 14]. Besides its correlation with non-neoplastic diseases [ref. 7, ref. 10, ref. 11, ref. 15], SMARCA1 has also been observed in numerous malignancies, such as soft tissue sarcoma [ref. 16], colorectal cancer [ref. 17], gastric cancer [ref. 18], and urothelial cancer [ref. 19]. However, a comprehensive big data-based pan-cancer analysis of the correlation between SMARCA1 and different types of carcinomas is yet to be undertaken. This study outlines the pathways mediated by SMARCA1 in different disorders and cancers based on present cell- or animal-experimental evidence (S1 Fig).
We conducted a pan-cancer analysis of SMARCA1 based on the TCGA and GTEx databases and investigated the underlying molecular mechanisms of SMARCA1 in carcinogenesis, clinical prognosis and targeted therapy of various carcinomas.
2. Materials and methods
The methods are summarized in S2 Fig.
2.1 Genome and proteomic structure analysis
Genome annotations of the SMARCA1 gene were obtained from the University of California Santa Cruz (UCSC) genome browser (http://genome.ucsc.edu/) according to the human Dec 2013 (GRch38/hg28) assembly [ref. 20]. Analysis of the conserved domain of SMARCA1 was performed using the HemoloGene database (http://www.ncbi.nlm.nih.gov/homologene/) [ref. 21]. In addition, we acquired the SMARCA1 phylogenetic tree for different species based on NCBI’s constraint-based multiple alignment tool (COBALT) which computed protein sequence alignment using conserved domains and local sequence similarity information (http://www.ncbi.nlm.nih.gov/tools/cobalt) [ref. 22].
2.2 Gene expression analysis with HPA
The human protein atlas (HPA) database [ref. 23], a spatial map of the human proteome (http://www.proteinatlas.org/humanproteome/pathology) was used to ascertain the physiological and pathological expression data of the SMARCA1 gene in different tissues and cells by inputting the term “SMARCA1”. “Low specificity” was considered as “Normalized expression (NX) ≥ 1 in at least one tissue/region/cell type without being elevated. “Enhanced” was when “NX levels of a group (of 1–5 tissues or 1–10 cell types or 1–5 brain regions) elevated to at least four times the mean of other tissue/region/cell types”. Detailed information at: https://www.proteinatlas.org/ENSG00000102038-SMARCA1.
2.3 Gene expression analysis with TIMER2
The tumor immune estimation resource (TIMER), version 2.0 database (http://timer.comp-genomics.org), based on TCGA, is a comprehensive web resource for the systematical evaluation of the clinical relevance of tumor-immune infiltrates and differential gene correlation analysis [ref. 24]. We used TIMER 2.0’s “Gene_DE” module to explore the difference in SMARCA1 expression between tumor and adjacent normal tissues.
2.4 Gene expression analysis with GEPIA2
Gene expression profiling interactive analysis (GEPIA), version 2.0 is a public (http://gepia.cancer-pku.cn/index.html) web application based on GTEx and TCGA databases [ref. 25]. We used it to assess further the difference in expression of SMARCA1 between tumor and the corresponding normal tissues, for tumors with significantly restricted normal or without normal tissues in TIMER2.0 [e.g., Adrenocortical Carcinoma (ACC), Lower Grade Glioma (LGG), etc.]. Configuration was as follows: the cutoff of Log2FC (fold change) and P-value were 1 and 0.01 respectively, and TCGA normal and GTEx data were matched. Additionally, we evaluated the SMARCA1 expression level in each pathological stage of all TCGA carcinomas using the “Expression DIY-Stage plot” module of GEPIA2. The log2(TPM (Transcripts per million) + 1) for the log-scale was applied in assessments.
2.5 Gene expression analysis with UALCAN
UALCAN (http://ualcan.path.uab.edu/index.html) is a comprehensive and interactive public resource for cancer OMICS data analysis [ref. 26], provided by the Clinical proteomic tumor analysis consortium (CPTAC) dataset [ref. 27]. We used it to conduct translational level analysis of the SMARCA1 gene. Using “SMARCA1” as the search keyword, we explored and compared the total protein expression levels (NP_001269803.1) between normal and primary tumor tissues of the five available tumors (breast cancer, ovarian cancer, clear cell renal cell carcinoma (RCC), uterine corpus endometrial carcinoma (UCEC) and lung adenocarcinoma (LUAD)).
2.6 Gene expression analysis with Oncomine
For further verification, the Oncomine database, currently the world’s largest database of oncogene chips and features an integrated data mining platform (https://www.oncomine.org) [ref. 5], was used to assess the difference in SMARCA1 expression between tumor and normal tissues under the default settings (with a threshold of “FC = 1.5, P-value = 0.05, and Gene rank = Top 10%”). Several comparisons across at least 6 analyses were obtained with the included studies’ median rank, P-value, and legends.
2.7 Prognosis—survival analysis
Correlation maps for SMARCA1 expression, overall survival (OS) and disease-free survival (DFS) for cancers in TCGA were obtained using the “Survival Map” module of GEPIA2 [ref. 25]. The median, estimated by the Mantel-Cox test was used as the cutoff value (cutoff-high = 50%, cutoff-low = 50%). Subsequently, relevant Kaplan-Meier curves were obtained using the same module with the log-rank test and default parameters.
The Kaplan-Meier Plotter database [ref. 28] (http://kmplot.com/analysis) was constructed based on gene microarray and RNA-seq data from the gene expression omnibus (GEO) [ref. 29], European genome-phenome archive (EGA) [ref. 30], and TCGA public databases. We conducted a series of survival analyses of the relationships between SMARCA1 and various cancers to determine OS, relapse-free survival (RFS), distant metastasis-free survival (DMFS), post-progression survival (PPS), progress-free survival (PFS), first progression (FP) and disease-specific survival (DSS). The parameters were as follows: Affymetrix id/Gene symbol: use mean expression of selected genes (203873_at, 203874_s_at, 203875_at, 215294_s_at) in breast, ovarian, lung and gastric cancers; use RNA-seq id_6594 in liver cancer; patients split by auto-select best cutoff; HR: yes; 95% confidence interval (CI): yes; with the remaining settings set to their default values.
We also screened the clinical indicators for the subgroup analyses to find out the high-risk factors related to the SMARCA1 expression and prognosis of different cancers [e.g., stage, grade, AJCC_T, gender, race, alcohol consumption, intrinsic subtype, surgery, or chemotherapy, etc.]. Then we imported the metan module of STATA 15.0 software (College Station, TX, StataCorp LP, USA) [ref. 31] to perform a meta-analysis of the above data. Z-test was used and a forest plot was plotted.
2.8 Genetic alteration analysis
Using cBioPortal (http://www.cbioportal.org) for cancer genomics visualization [ref. 32–ref. 34], we selected “Quick select; TCGA PanCancer Atlas Studies” on the home page and queried for “SMARCA1” genetic variation characteristics. Data including alteration frequency, mutation type and copy number alteration (CNA) for cancers in TCGA was extracted. Next, mutated site results of SMARCA1 exhibited in the pattern chart of the three-dimensional (3D) or protein structure through the “Mutations” module were obtained. Differences in OS, DFS, PFS and DSS with and without SMARCA1 gene variation were compared using the “Comparison” module.
2.9 DNA methylation analysis
We conducted DNA methylation analysis for the SMARCA1 gene for numerous probes (e.g., cg10076009, cg18751555, etc.) and different cancers using the MEXPRESS database (http://mexpress.be/) [ref. 35]. In MEXPRESS, DNA methylation, expression and clinical data was visualized, as well as Pearson correlation coefficient R-values and Benjamini-Hochberg-adjusted P-values were analyzed.
2.10 Phosphorylation feature analysis
We also explored the expression level of SMARCA1 of the phospho-protein (at the S116 site) using UALCAN. We retrieved the predicted phosphorylation features of the site via querying for “SMARCA1” in the PhosphoNET database (http://www.phosphonet.ca/), an open-access human phosphosite knowledgebase [ref. 36].
2.11 Tumor-related immune infiltration analysis
We selected cancer-associated fibroblasts and the immune cells of CD8+ T-cells in the “immune-Gene” module of the TIMER2 database to assess the potential correlation between SMARCA1 expression and tumor-related immune infiltrates across 33 cancers in TCGA. We visualized the data with heatmaps [ref. 24] and scatter plots via immune infiltration evaluation with the QUANTISEQ, TIMER, MCPCOUNTER, XCELL, CIBERSORT, CIBERSORT-ABS, TIDE and EPIC algorithms applied by purity-adjusted Spearman’s rank correlation test.
2.12 Gene-immune analysis
Sangerbox database (http://www.sangerbox.com), based on TCGA and GEO databases, is a practical bioinformation analysis tool [ref. 37]. We used it to analyze the potential relationship between SMARCA1 expression and microsatellite instability (MSI) or tumor mutational burden (TMB). The partial correlation value (cor) and P-value were calculated using Spearman’s rank test and circle plots.
2.13 Gene enrichment analysis
The STRING database (http://string-db.org/) [ref. 38], which supports the functional proteins association networks, was used for SMARCA1-related proteomic analysis. We set the main parameters as follows: protein name (“SMARCA1”), organism (“Homo sapiens”), the meaning of network edges (“evidence”), active interaction sources (“Experiments”), the minimum required interaction score [“low confidence (0.150)”] and max number of interactors to show [“1st shell: no more than 50 interactors”]. Finally, we acquired the SMARCA1-related protein networks diagram by enrichment analysis.
First, we retrieved data for the top 100 SMARCA1-related/similar genes via the “similar genes detection” module of GEPIA2 based on all tumor and normal tissues in TCGA. Then we performed a pairwise Pearson correlation analysis of SMARCA1 and the selected genes using the “correlation analysis” module of GEPIA2. Afterward, we applied the “Gene_corr” module of TIMER2 to perform the purity-adjusted Spearman’s rank correlation analysis and the selected genes in a heatmap with statistically significant data. This was followed by interaction analysis of SMARCA1-correlated and interacted genes on Jvenn (http://jvenn.toulouse.inra.fr/app/example.html), which is an interactive Venn diagram viewer [ref. 39]. We combined the two gene lists to conduct a Kyoto encyclopedia of genes and genomes (KEGG) pathway analysis visualized with the “tidyr” and “ggplot2” packages in R. The data was obtained from the functional annotation chart using the DAVID Bioinformatics Resources 6.8 [ref. 40, ref. 41] by uploading gene lists, followed by its analysis wizard. We also conducted Gene ontology (GO) enrichment analysis using R’s (version 4.0.3, www.r-project.org) [ref. 42] “clusterProfiler” package. All the data analysis output visualized cnetplots (node_label = T, colorEdge = T, circular = F), including biological process (BP), cellular component (CC) and molecular function (MF). Two-tailed P value less than 0.05 is regarded as statistically significant.
2.14 Diagnostic capability analysis of SMARCA1
Based on the TCGA and GTEx database data, we conducted a diagnostic capability analysis of SMARCA1 pan-cancer using receiver operating characteristic (ROC) curves. The area under curve (AUC) was calculated for evaluating the diagnostic value of SMARCA1.
2.15 Statistical analysis
All statistical analyses were performed with R (version 4.0.3). Normally distributed variables were analyzed using the t-test and one-way ANOVA test and non-normally distributed variables with nonparametric tests. Log-rank test and cox regression were used for survival analysis, Pearson’s correlation and spearman’s rank correlation test for correlation analysis. p-value < 0.05 was considered statistically significant.
3. Results
3.1 Gene expression analysis
This study aimed to assess the tumorigenic role of human SMARCA1 (NM_003069.5 for mRNA or NP_003060.2 for protein, S3A Fig). The conserved domains of SMARCA1 protein structure are similar among different species (e.g., X.tropicalis, D.rerio, H.sapiens, etc.), such as HAND (pfam09110), HELICc (cd00079) and SANT (cl17250) domains (S3B Fig). The phylogenetic tree (S4 Fig) demonstrated an evolutionary correlation of SMARCA1 in different species.
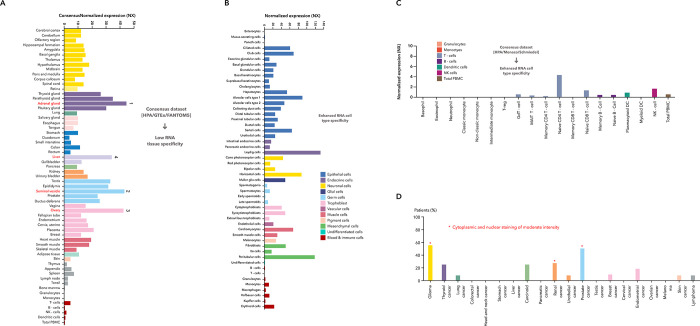
We obtained the RNA expression pattern of SMARCA1 in different single cell types and normal tissues based on the combined analysis of the GTEx, Human protein atlas (HPA) and Function annotation of the mammalian genome 5 (FANTOM5) datasets. SMARCA1 expression is highest in the adrenal gland, followed by the seminal vesicle, ovary and liver (Fig 1A) by tissue and in Leydig and peritubular cells by cell type (Fig 1B). Although SMARCA1 expression can be observed in nearly all the tissues detected (consensus normalized expression (NX) > 1), low RNA tissue specificity and enhanced RNA cell type specificity appears both in different single cell types and blood cells (Fig 1C). Furthermore, SMARCA1 expression in the cytoplasm and nucleus reaches moderate intensity in glioma, prostate and renal (Fig 1D).
We analyzed SMARCA1 expression levels in all tumors of TCGA via TIMER2. As shown in Fig 2A, the level of SMARCA1 expression in the cancer tissues of bladder urothelial carcinoma (BLCA), breast invasive carcinoma (BRCA), colon adenocarcinoma (COAD), kidney chromophobe (KICH), kidney renal clear cell carcinoma (KIRC), prostate adenocarcinoma (PRAD), rectum adenocarcinoma (READ), skin cutaneous carcinoma (SKCM), thyroid carcinoma (THCA), uterine corpus endometrial carcinoma (UCEC) (P < 0.001), kidney renal papillary cell carcinoma (KIRP), lung squamous cell carcinoma (LUSC) (P < 0.01), cervical squamous cell carcinoma and endocervical adenocarcinoma (CESC) and cholangiocarcinoma (CHOL) (P < 0.05) is lower than the adjacent normal tissues. On the contrary, the expression in the tumor tissues of lung adenocarcinoma (LUAD) and liver hepatocellular carcinoma (LIHC) is higher.
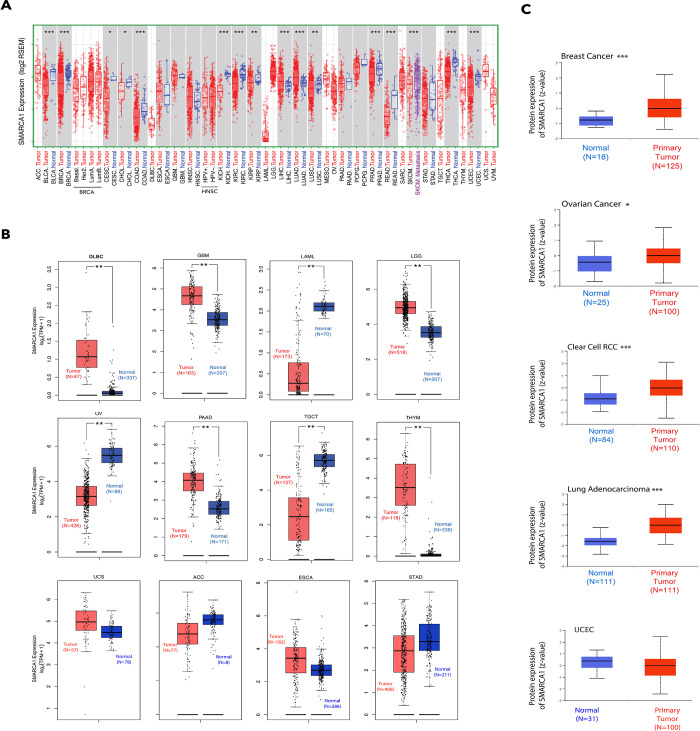
We proceeded to include data of the normal tissues from the GTEx database as controls for evaluating the difference in SMARCA1 expression between tumor and normal tissues of diffuse large B cell lymphoma (DLBC), glioblastoma multiforme (GBM), acute myeloid leukemia (LAML), brain lower grade glioma (LGG), ovarian serous cystadenocarcinoma (OV), pancreatic adenocarcinoma (PAAD), testicular germ cell tumors (TGCT), and thymoma (THYM) (P < 0.01). However, we did not observe a significant difference in other cancers, including adrenocortical carcinoma (ACC), esophageal carcinoma (ESCA), stomach adenocarcinoma (STAD) and uterine carcinosarcoma (UCS) (Fig 2B).
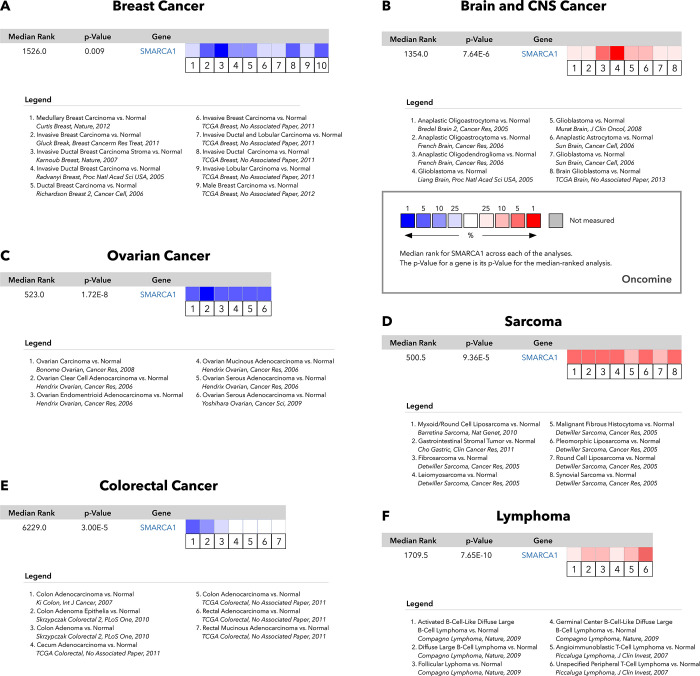
According to the analysis using the CPTAC database, we found that SMARCA1 total protein expression was higher in the primary tumor tissues of breast cancer, clear cell RCC, LUAD (P < 0.001), and ovarian cancer (P < 0.05) than in normal tissues except in the case of UCEC (Fig 2C). The results of pooling analysis in the Oncomine database further confirmed the findings for breast cancer, ovarian cancer, and colorectal cancer (all P < 0.01). However higher expression was observed in brain and CNS cancer, sarcoma and lymphoma (all P < 0.001) compared to the control (Fig 3).
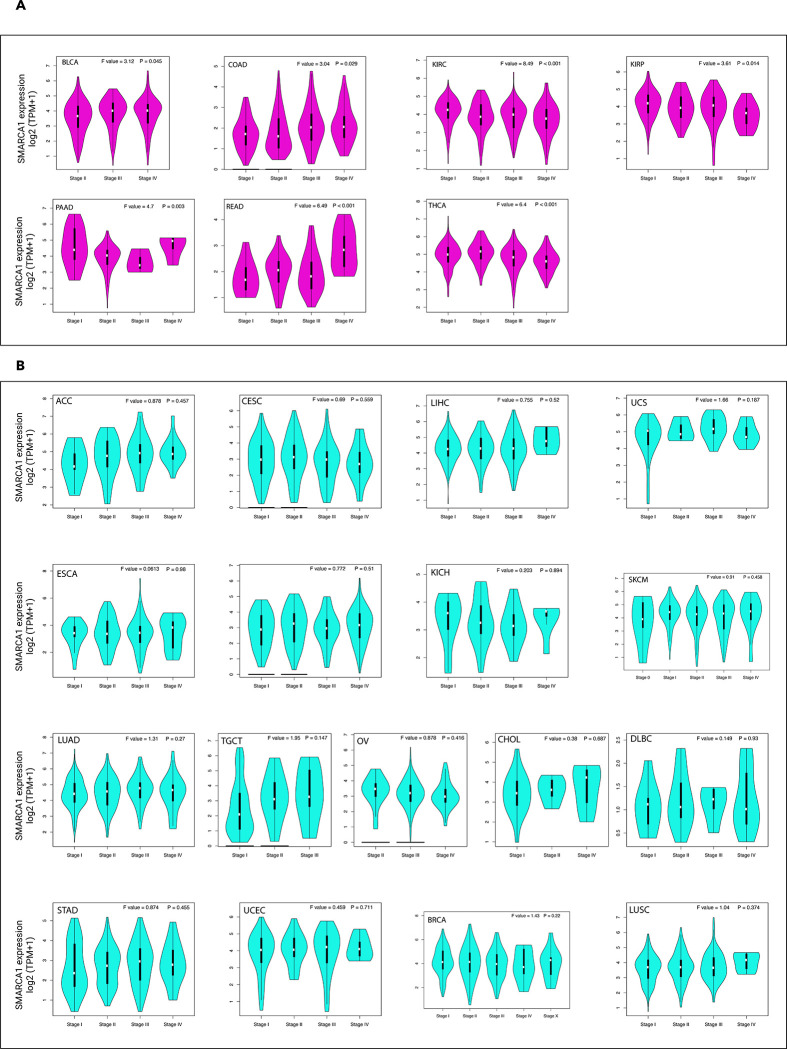
We also investigated the relationship between SMARCA1 expression and different pathological stages of various cancers via the “pathological stage plot” module of GEPIA2. Significant differences were observed in BLCA, COAD, KIRP, KIRC, PAAD, READ and THCA (all P < 0.05) (Fig 4A) but not in others (Fig 4B).
3.2 Survival analysis
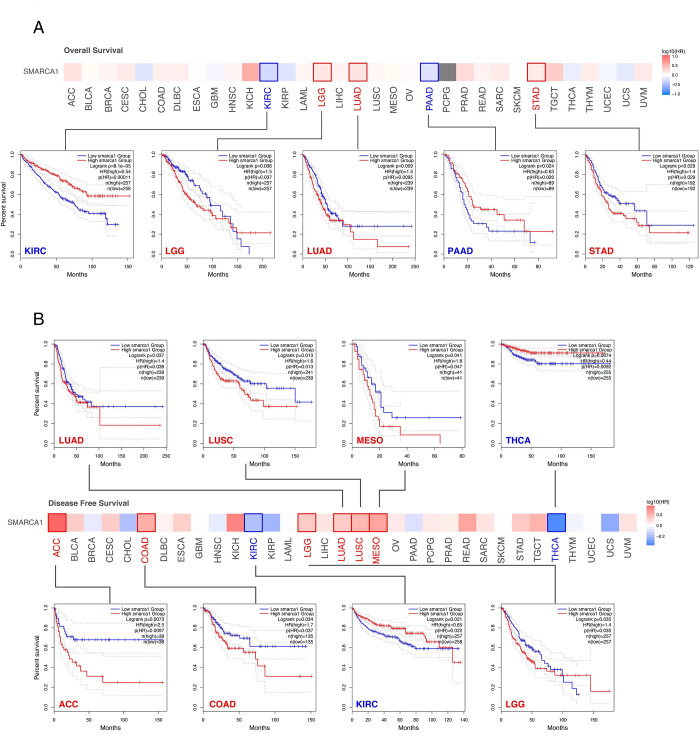
We divided the cases into two groups according to high or low expression of SMARCA1 to assess the relationships between SMARCA1 expression and patient prognosis in different cancers, based on the TCGA and GEO databases. High expression of SMARCA1 was related to poor overall survival (OS) in patients with LGG (P = 0.036), LUAD (P = 0.009), and STAD (P = 0.029). Low expression was associated with poor OS in KIRC (P < 0.001) and PAAD (P = 0.024) (Fig 5A). Similarly, high expression of SMARCA1 was associated with poor disease-free survival (DFS) for LUAD (P = 0.037),lung squamous cell carcinoma (LUSC) (P = 0.013), mesothelioma (MESO) (P = 0.041), adrenocortical carcinoma (ACC) (P = 0.0073), COAD (P = 0.034) and LGG (P = 0.035), low expression in THCA (P = 0.0074) and KIRC (P = 0.021) (Fig 5B).
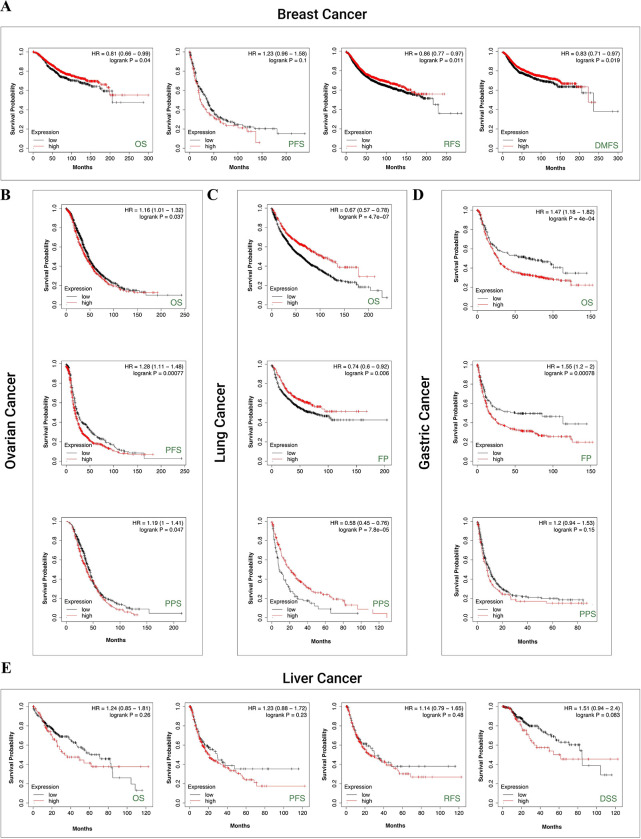
We used the Kaplan-Meier plotter to evaluate the correlation between SMARCA1 expression and five cancers. For breast cancer, low SMARCA1 expression was linked to poor OS (P = 0.04), relapse-free survival (RFS) (P = 0.011) and distant metastasis-free survival (DMFS) (P = 0.019) but not progress-free survival (PFS) (Fig 6A). The same was observed in OS (P < 0.001), first progression (FP) (P = 0.006) and post-progression survival (PPS) (P < 0.001) of lung cancer (Fig 6C). In contrast, high SMARCA1 expression was related to poor OS (P = 0.037), PFS (P < 0.001) and PPS (P = 0.047) in ovarian cancer (Fig 6B), as well as to OS (P < 0.001), FP (P < 0.001) in gastric cancer (Fig 6D). No significant difference based on SMARCA1 expression in relation to OS, PFS, RFS and disease-specific survival (DSS) was observed in liver cancer (all P > 0.05) (Fig 6E).
We performed a meta-analysis (Fig 7) to validate the correlation observed in breast cancer (P = 0.001), lung cancer, ovarian cancer and gastric cancer (all P < 0.001) again and to identify any potential SMARCA1-prognosis correlation in liver cancer (P = 0.021). We performed a series of subgroup analyses through restricted sub-types or select cohorts and obtained distinct findings (Tables 1–5). We found SMARCA1-associated prognosis to correlate with tumor type and clinical risk factors.
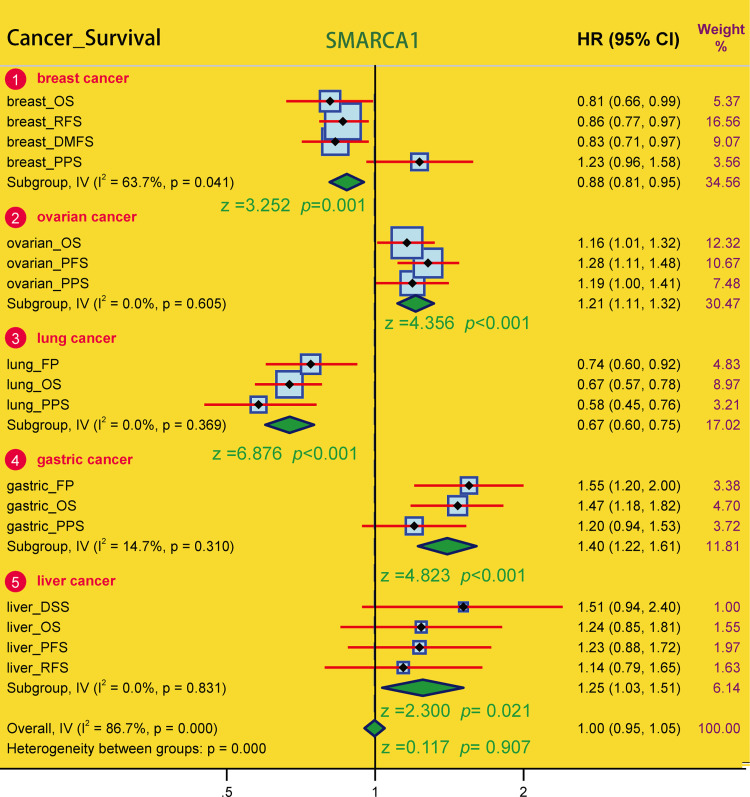
Table 1: Subgroup analysis on the correlation of SMARCA1 expression and prognosis of breast cancer cases.
| Factor | Subgroup | Sample size | OS | RFS | PPS | DMFS | ||||
|---|---|---|---|---|---|---|---|---|---|---|
| HR | P | HR | P | HR | P | HR | P | |||
| ER status-IHC | ER positive | 3499 | 0.72 | 0.038 | 0.87 | 0.11 | 1.35 | 0.18 | 0.82 | 0.16 |
| ER negative | 2168 | 1.32 | 0.11 | 1.18 | 0.12 | 0.65 | 0.098 | 1.14 | 0.37 | |
| ER status-array | ER positive | 5526 | 1.16 | 0.24 | 0.85 | 0.014 | 1.38 | 0.019 | 0.82 | 0.051 |
| ER negative | 2009 | 1.22 | 0.27 | 1.1 | 0.3 | 0.69 | 0.11 | 1.24 | 0.12 | |
| TP53 status | mutated | 272 | 1.76 | 0.1 | 1.63 | 0.049 | 0.68 | 0.44 | 2.21 | 0.033 |
| Wild type | 388 | 0.44 | 0.0085 | 0.81 | 0.31 | 0.48 | 0.038 | 0.34 | 0.0022 | |
| PR status-IHC | PR positive | 1559 | 0.71 | 0.37 | 0.73 | 0.032 | 0.41 | 0.11 | 0.57 | 0.029 |
| PR negative | 1989 | 1.46 | 0.13 | 0.83 | 0.13 | 2.95 | 0.029 | 0.78 | 0.096 | |
| HER2 status-array | HER2 positive | 1273 | 0.7 | 0.064 | 0.85 | 0.13 | 0.83 | 0.43 | 0.99 | 0.95 |
| HER2 negative | 6262 | 1.13 | 0.28 | 0.86 | 0.026 | 1.35 | 0.039 | 0.82 | 0.026 | |
| Grade | Grade 1 | 576 | 0.68 | 0.39 | 0.55 | 0.02 | 0.39 | 0.13 | 0.44 | 0.095 |
| Grade 2 | 1795 | 0.58 | 0.0069 | 0.73 | 0.0048 | 0.72 | 0.17 | 0.7 | 0.019 | |
| Grade 3 | 2058 | 1.31 | 0.11 | 1.17 | 0.12 | 1.3 | 0.21 | 1.19 | 0.22 | |
| Intrinsic subtype | Basal | 1494 | 1.17 | 0.42 | 1.45 | 0.0034 | 0.6 | 0.08 | 1.26 | 0.16 |
| Luminal A | 3511 | 1.22 | 0.23 | 0.84 | 0.048 | 1.41 | 0.059 | 0.76 | 0.044 | |
| Luminal B | 2015 | 1.2 | 0.31 | 0.88 | 0.15 | 1.46 | 0.079 | 0.8 | 0.12 | |
| HER2+ | 515 | 1.79 | 0.056 | 0.87 | 0.47 | 0.77 | 0.49 | 1.51 | 0.11 | |
| Lymph node status | Lymph node positive | 2153 | 0.73 | 0.057 | 0.79 | 0.012 | 0.6 | 0.015 | 0.72 | 0.013 |
| Lymph node negative | 2829 | 0.79 | 0.18 | 0.91 | 0.31 | 0.8 | 0.28 | 0.87 | 0.28 | |
| Pietenpol subtype | Basal-like 1 | 418 | 0.52 | 0.11 | 1.5 | 0.14 | 0.2 | 0.01 | 0.68 | 0.21 |
| Basal-like 2 | 165 | 2.06 | 0.14 | 1.43 | 0.28 | NA | NA | 2.53 | 0.12 | |
| immunomodulatory | 462 | 2.79 | 0.0084 | 1.54 | 0.12 | 4.58 | 0.015 | 2.03 | 0.0099 | |
| Mesenchymal | 382 | 1.63 | 0.15 | 1.49 | 0.046 | 0.67 | 0.36 | 1.36 | 0.31 | |
| Mesenchymal stem-like | 201 | 4.03 | 0.048 | 3.69 | 0.021 | NA | NA | 3.04 | 0.071 | |
| Luminal androgen receptor | 413 | 0.47 | 0.04 | 0.57 | 0.012 | 0.6 | 0.23 | 0.56 | 0.069 | |
HR, hazard ratio; OS, overall survival; RFS, relapse free survival; DMFS, distant metastasis free survival; PPS, post progression survival; ER, Estrogen receptor; PR, Progesterone receptor; HER2, human epidermal growth factor receptor-2; TP53, Tumor Protein P53; NA, not available data; P value less than 0.05 is shown in bold.
Table 5: Subgroup analysis on the correlation of SMARCA1 expression and prognosis of liver cancer cases.
| Factor | Subgroup | Sample size | OS | PFS | RFS | DSS | ||||
|---|---|---|---|---|---|---|---|---|---|---|
| HR | P | HR | P | HR | P | HR | P | |||
| Stage | Stage 1 | 171 | 1.55 | 0.24 | 1.84 | 0.062 | 0.59 | 0.072 | 2.66 | 0.11 |
| Stage 2 | 86 | 1.9 | 0.11 | 1.49 | 0.21 | 1.98 | 0.048 | 3.53 | 0.016 | |
| Stage 3 | 85 | 0.63 | 0.14 | 2.31 | 0.025 | 1.45 | 0.23 | 1.55 | 0.22 | |
| Stage 4 | 5 | NA | NA | NA | NA | NA | NA | NA | NA | |
| Grade | Grade 1 | 55 | 0.21 | 3.9e-04 | 0.44 | 0.069 | 0.38 | 0.082 | 0.35 | 0.087 |
| Grade 2 | 177 | 1.6 | 0.074 | 0.91 | 0.67 | 0.78 | 0.38 | 1.9 | 0.054 | |
| Grade 3 | 122 | 1.4 | 0.33 | 1.98 | 0.022 | 2.07 | 0.024 | 1.79 | 0.14 | |
| Grade 4 | 12 | NA | NA | NA | NA | NA | NA | NA | NA | |
| AJCC_T | T1 | 181 | 1.66 | 0.17 | 1.89 | 0.051 | 0.64 | 0.11 | 3.07 | 0.057 |
| T2 | 94 | 1.89 | 0.092 | 1.48 | 0.19 | 1.79 | 0.079 | 2.94 | 0.021 | |
| T3 | 80 | 0.63 | 0.16 | 2.04 | 0.06 | 1.43 | 0.36 | 2.14 | 0.21 | |
| T4 | 13 | NA | NA | NA | NA | NA | NA | NA | NA | |
| Gender | Female | 121 | 2.24 | 0.0045 | 2.37 | 0.0015 | 2.5 | 0.0044 | 3.46 | 9.3e-04 |
| Male | 250 | 0.58 | 0.023 | 0.66 | 0.025 | 0.61 | 0.014 | 0.65 | 0.14 | |
| Vascular invasion | None | 205 | 1.44 | 0.18 | 1.36 | 0.23 | 0.75 | 0.27 | 1.92 | 0.095 |
| micro | 93 | 1.72 | 0.17 | 1.3 | 0.41 | 0.8 | 0.48 | 3.83 | 0.16 | |
| macro | 16 | NA | NA | NA | NA | NA | NA | NA | NA | |
| Race | White | 184 | 1.37 | 0.19 | 1.36 | 0.16 | 1.21 | 0.42 | 1.89 | 0.024 |
| Asian | 158 | 0.58 | 0.08 | 1.5 | 0.15 | 1.41 | 0.25 | 0.59 | 0.2 | |
| Black or African american | 17 | NA | NA | NA | NA | NA | NA | NA | NA | |
| Sorafenib treatment | treated | 30 | 5.06 | 0.0035 | 1.93 | 0.099 | 1.74 | 0.24 | 5.06 | 0.0035 |
| Alcohol consumption | Yes | 117 | 0.56 | 0.075 | 0.67 | 0.14 | 0.56 | 0.055 | 0.77 | 0.47 |
| none | 205 | 1.24 | 0.38 | 1.65 | 0.037 | 1.73 | 0.043 | 2.07 | 0.023 | |
| Hepatitis virus | Yes | 153 | 0.64 | 0.2 | 0.64 | 0.074 | 0.68 | 0.14 | 1.5 | 0.35 |
| none | 169 | 1.57 | 0.073 | 1.81 | 0.012 | 1.51 | 0.11 | 2.09 | 0.015 | |
HR, hazard ratio; AJCC. American Joint Committee on Cancer; OS, overall survival; PFS, progress free survival; RFS, relapse free survival; DSS, disease specific survival; NA, not available data; P value less than 0.05 is shown in bold.
Table 2: Subgroup analysis on the correlation of SMARCA1 expression and prognosis of ovarian cancer cases.
| Factor | Subgroup | Sample size | OS | PFS | PPS | |||
|---|---|---|---|---|---|---|---|---|
| HR | p | HR | p | HR | p | |||
| Histology | Endometrioid | 62 | 0.35 | 0.23 | 0.28 | 0.0045 | NA | NA |
| Serous | 1232 | 1.22 | 0.021 | 1.13 | 0.14 | 1.17 | 0.087 | |
| Stage | Stage 1 | 107 | 0.68 | 0.53 | 0.41 | 0.23 | NA | NA |
| Stage 2 | 72 | 0.35 | 0.16 | 0.52 | 0.058 | 3.65 | 0.19 | |
| Stage 3 | 1079 | 1.29 | 0.0048 | 1.11 | 0.2 | 1.22 | 0.035 | |
| Stage 4 | 189 | 0.8 | 0.25 | 1.52 | 0.038 | 0.73 | 0.22 | |
| Grade | Grade 1 | 56 | 0.47 | 0.18 | 0.23 | 0.035 | NA | NA |
| Grade 2 | 325 | 1.23 | 0.19 | 1.45 | 0.025 | 1.19 | 0.37 | |
| Grade 3 | 1024 | 1.19 | 0.04 | 1.14 | 0.14 | 1.18 | 0.1 | |
| Grade 4 | 21 | 2.17 | 0.11 | NA | NA | NA | NA | |
| TP53 mutation | Mutated | 516 | 0.91 | 0.43 | 1.35 | 0.026 | 0.79 | 0.089 |
| Wild type | 102 | 2.2 | 0.021 | 1.72 | 0.058 | 1.79 | 0.11 | |
| Debulk | optimal | 802 | 1.13 | 0.28 | 1.24 | 0.044 | 0.85 | 0.28 |
| suboptimal | 536 | 1.31 | 0.0083 | 1.6 | 1.3e-05 | 1.49 | 0.0026 | |
| Chemotherapy | Contains platin | 1438 | 1.21 | 0.015 | 1.35 | 2.6e-05 | 1.2 | 0.06 |
| Contains Taxol | 821 | 1.27 | 0.015 | 1.23 | 0.024 | 1.29 | 0.017 | |
| Contains Taxol+platin | 804 | 1.28 | 0.015 | 1.25 | 0.014 | 1.31 | 0.012 | |
| Contains Avastin | 50 | 0.31 | 0.01 | 0.44 | 0.019 | 0.29 | 0.0088 | |
| Contains Docetaxel | 108 | 0.57 | 0.057 | 0.63 | 0.085 | 0.66 | 0.19 | |
| Contains Gemcitabine | 135 | 0.65 | 0.033 | 1.23 | 0.31 | 0.61 | 0.063 | |
| Contains Paclitaxel | 248 | 0.63 | 0.059 | 1.16 | 0.46 | 0.54 | 0.032 | |
| Contains Topotecan | 119 | 0.66 | 0.062 | 1.39 | 0.1 | 0.73 | 0.13 | |
HR, hazard ratio; OS, overall survival; PFS, progress free survival; PPS, post progression survival; TP53, Tumor Protein P53; NA, not available data; P value less than 0.05 is shown in bold.
Table 3: Subgroup analysis on the correlation of SMARCA1 expression and prognosis of lung cancer cases.
| Factor | Subgroup | Sample size | OS | FP | PPS | |||
|---|---|---|---|---|---|---|---|---|
| HR | P | HR | HR | P | HR | |||
| Histology | adenocarcinoma | 865 | 0.53 | 2.1e-06 | 0.69 | 0.02 | 0.55 | 0.016 |
| squamous cell carcinoma | 675 | 1.22 | 0.11 | 1.94 | 0.012 | 1.87 | 0.23 | |
| gender | female | 817 | 0.58 | 3e-04 | 0.63 | 0.0074 | 0.62 | 0.022 |
| male | 1387 | 0.72 | 1.3e-04 | 0.77 | 0.069 | 0.57 | 0.0015 | |
| smoking history | exclude those never smoked | 970 | 0.8 | 0.069 | 1.37 | 0.015 | 0.59 | 0.0011 |
| only those never smoked | 247 | 0.35 | 1.2e-04 | 0.41 | 1.3e-04 | 0.4 | 0.009 | |
| stage | stage I | 652 | 0.51 | 6.7e-07 | 0.71 | 0.13 | 0.4 | 0.0021 |
| stage II | 320 | 0.56 | 0.013 | 2.05 | 0.044 | 0.47 | 0.02 | |
| stage III | 70 | 1.28 | 0.39 | NA | NA | NA | NA | |
| stage IV | 4 | NA | NA | NA | NA | NA | NA | |
| grade | grade I | 202 | 1.22 | 0.27 | 0.54 | 0.024 | 0.81 | 0.45 |
| grade II | 310 | 1.56 | 0.0064 | 1.6 | 0.044 | 1.47 | 0.15 | |
| grade III | 77 | 1.25 | 0.51 | 1.88 | 0.2 | 0.23 | 0.022 | |
| AJCC stage t | t1 | 475 | 0.71 | 0.02 | 2.29 | 0.0021 | 0.56 | 0.097 |
| t2 | 686 | 1.48 | 5.5e-04 | 1.74 | 2.9e-04 | 0.67 | 0.022 | |
| t3 | 99 | 1.31 | 0.33 | 0.56 | 0.23 | NA | NA | |
| t4 | 48 | 1.74 | 0.091 | NA | NA | NA | NA | |
| AJCC stage n | n0 | 863 | 1.13 | 0.34 | 1.75 | 7e-04 | 0.58 | 0.0077 |
| n1 | 296 | 1.19 | 0.28 | 2.31 | 3.7e-4 | 0.51 | 0.013 | |
| n2 | 113 | 1.22 | 0.37 | 0.49 | 0.051 | 1.91 | 0.15 | |
| AJCC stage m | m0 | 818 | 1.16 | 0.16 | 1.67 | 0.062 | 0.62 | 0.16 |
| m1 | 10 | NA | NA | NA | NA | NA | NA | |
| surgery | only surgical margins negative | 730 | 0.62 | 5.3e-05 | 0.54 | 1.1e-06 | 0.68 | 0.012 |
| radiotherapy | no | 276 | 0.81 | 0.28 | 0.72 | 0.11 | 0.64 | 0.059 |
| yes | 73 | 1.72 | 0.1 | 1.64 | 0.13 | 0.64 | 0.18 | |
| chemotherapy | no | 317 | 0.65 | 0.015 | 1.35 | 0.15 | 1.49 | 0.14 |
| yes | 178 | 0.46 | 0.0018 | 1.45 | 0.13 | 0.58 | 0.046 | |
HR, hazard ratio; AJCC. American Joint Committee on Cancer; OS, overall survival; FP, first progression; PPS, post progression survival; NA, not available data; P value less than 0.05 is shown in bold.
Table 4: Subgroup analysis on the correlation of SMARCA1 expression and prognosis of gastric cancer cases.
| Factor | Subgroup | Sample size | OS | FP | PPS | |||
|---|---|---|---|---|---|---|---|---|
| HR | P | HR | P | HR | P | |||
| Gender | Female | 244 | 1.4 | 0.086 | 1.73 | 0.031 | 1.42 | 0.098 |
| Male | 566 | 1.59 | 8.2e-04 | 1.6 | 0.0024 | 1.16 | 0.31 | |
| Stage | Stage 1 | 69 | 3.1 | 0.039 | 2.6 | 0.1 | 4.48 | 0.0498 |
| Stage 2 | 145 | 2.28 | 0.0057 | 2.52 | 0.0023 | 2.01 | 0.036 | |
| Stage 3 | 319 | 1.66 | 7.7e-04 | 1.75 | 0.013 | 1.44 | 0.088 | |
| Stage 4 | 152 | 1.26 | 0.25 | 1.37 | 0.14 | 0.76 | 0.23 | |
| Stage t | t1 | 14 | NA | NA | NA | NA | NA | NA |
| t2 | 253 | 1.99 | 0.0013 | 2.28 | 6.5e-05 | 1.7 | 0.019 | |
| t3 | 208 | 1.3 | 0.16 | 1.4 | 0.099 | 1.42 | 0.099 | |
| t4 | 39 | 1.94 | 0.14 | 1.62 | 0.26 | 2.33 | 0.067 | |
| Stage n | n0 | 76 | 3.22 | 0.0051 | 3.4 | 0.0043 | 6.13 | 8.7e-04 |
| n1 | 232 | 1.79 | 0.0053 | 1.88 | 0.0013 | 1.54 | 0.095 | |
| n2 | 129 | 0.82 | 0.42 | 0.8 | 0.31 | 1.46 | 0.11 | |
| n3 | 76 | 1.77 | 0.048 | 2.17 | 0.019 | 1.39 | 0.29 | |
| Stage m | m0 | 459 | 1.67 | 0.001 | 1.69 | 4.6e-04 | 1.63 | 0.0076 |
| m1 | 58 | 1.67 | 0.096 | 1.75 | 0.063 | 0.5 | 0.091 | |
| HER2 | negative | 641 | 1.51 | 9.6e-04 | 1.73 | 7.9e-05 | 1.52 | 0.011 |
| positive | 424 | 1.66 | 0.0017 | 1.45 | 0.068 | 0.66 | 0.025 | |
| Lauren classification | Instestinal | 336 | 1.68 | 0.0011 | 1.76 | 0.0014 | 1.56 | 0.096 |
| Diffuse | 248 | 1.5 | 0.049 | 1.83 | 0.0085 | 1.58 | 0.053 | |
| Mixed | 33 | 4.88 | 0.09 | 4.68 | 0.1 | NA | NA | |
| Differentiation | Poorly | 166 | 1.41 | 0.14 | 0.69 | 0.18 | 0.45 | 0.02 |
| Moderately | 67 | 1.68 | 0.11 | 1.61 | 0.13 | 1.82 | 0.21 | |
| Well | 32 | 2.38 | 0.045 | NA | NA | NA | NA | |
| Treatment | Surgery alone | 393 | 1.67 | 0.0014 | 1.67 | 3.3e-04 | 1.6 | 0.0078 |
| 5-Fu based adjuvant | 157 | 0.62 | 0.0082 | 0.7 | 0.054 | 0.61 | 0.0069 | |
| Other adjuvent | 80 | 0.63 | 0.34 | 2.16 | 0.12 | 0.66 | 0.38 | |
| Perforation | No | 169 | 1.48 | 0.086 | 1.33 | 0.18 | 1.48 | 0.19 |
| yes | 4 | NA | NA | NA | NA | NA | NA | |
HR, hazard ratio; OS, overall survival; FP, first progression; PPS, post progression survival; HER2, human epidermal growth factor receptor-2; NA, not available data; P value less than 0.05 is shown in bold.
3.3 Genetic alteration analysis
Using the cBioPortal tool, we obtained the genetic variation status of SMARCA1 across different cancers in the TCGA database. The highest alteration frequency of SMARCA1 (> 10%) appeared in uterine cancers with “mutation” as the main component. “Deep deletion” showed an alteration frequency of ~4% in the uterine carcinosarcoma as the primary type (Fig 8A). Although “amplification” was predominant in renal clear cell carcinoma and “deep deletion” in mesothelioma, it is inconsequential due to having an alteration frequency < 2% (Fig 8A). Detailed information of mutation types, sites and frequencies of SMARCA1 variation is shown in Fig 8B. Missense alteration of SMARCA1 was the most common form and R993Q/*/P mutation in the SLIDE domain was detected in 4 cases of UCEC, 1 case of PRAD and 1 case of STAD (Fig 8B), which may result in frame-shift mutation of the SMARCA1 gene, translation from R (arginine) to Q (glutamine)/P (proline) at the 993 site of SMARCA1 protein and proceeding protein truncation. Although the complete structure of the SMARCA1 protein is unclear, the potential position of the R993 site can still be speculated in the 3D diagram (Fig 8C).
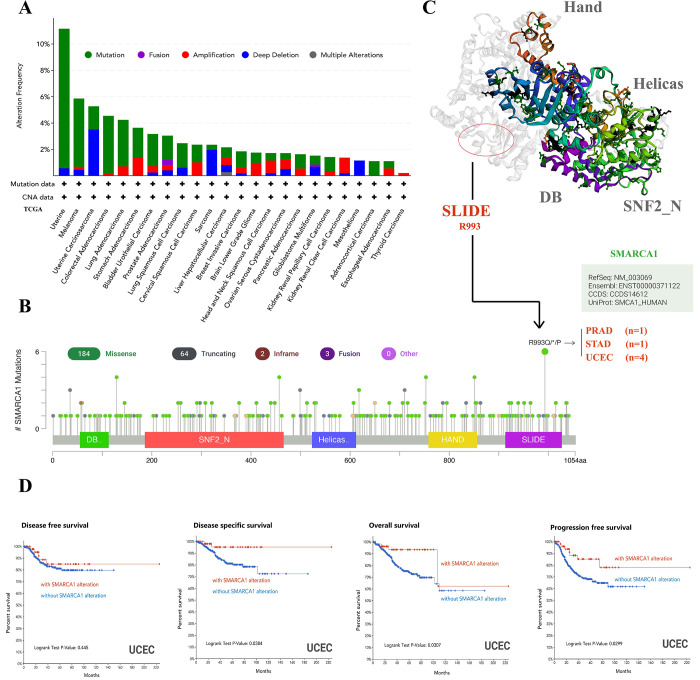
We assessed the link between SMARCA1 gene variation and clinical prognosis of different cancers. As presented in Fig 8D, UCEC patients with SMARCA1 mutation had better OS, DSS and PFS (all P < 0.05) but worse DFS (P = 0.445), compared to the control.
3.4 DNA methylation analysis
Using MEXPRESS, we looked into the potential relationship between SMARCA1 DNA methylation and oncogenesis in different neoplasms. Despite the insufficient methylation data, we could still observe some significant differences in several probes. With respect to LAML, we found a significant negative correlation at multiple probes (e.g., cg03460558, cg08617833, etc.) of the promoter region (all P < 0.001) (Fig 9A). Similarly, negative correlation was observed at probes (cg27353825, cg17420696, cg18959966) of non-promoter region in DLBC (P < 0.05) and in probes (cg04596655, cg27353825, cg18959966) of non-promoter region in LGG (P < 0.05) (Fig 9A). Interestingly, we not only found negative correlation in probes (cg08617833, cg24447042) of promoter region, but also positive correlation in probes (cg04596655, cg18751555) of non-promoter region appearing in TGCT (P < 0.05) (Fig 9A). Due to limited research on the field, we were unable to further verify the relationship between expression and DNA methylation of SMARCA1.
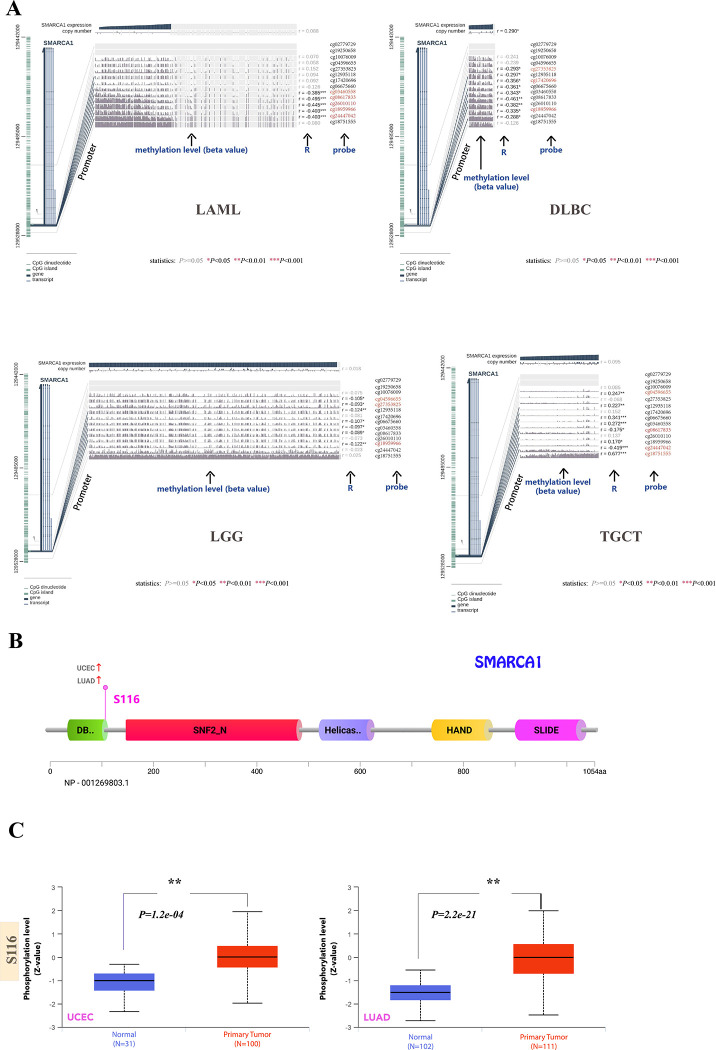
3.5 Protein phosphorylation analysis
Based on the CPTAC database, we investigated the differences in SMARCA1 protein phosphorylation between primary tumors and normal tissues. Owing to limited data, only UCEC and LUAD associated with S116 site were analyzed. Findings of correlation between SMARCA1 phosphorylation and tumor are summarized in Fig 9B. S116, located in the DB domain of SMARCA1 displays higher phosphorylation levels in primary tumor tissues compared to normal tissues for UCEC and LUAD (all P < 0.001) (Fig 9C). Reference parameters for the CPTAC-identified phosphorylation site of SMARCA1 using PhosphoNet database are listed in Table 6, however, these are not backed with experimental data. These results indicate that further investigation of SMARCA1 phosphorylation is warranted.
Table 6: Analysis of CPTAC-identified phosphorylation sites of SMARCA1 via the PhosphoNET database.
| site | sequence | experimentally confirmedt006fn001 | hydrophobicity | p-site similarity score | maximum kinase specificity | sum kinase specificity score | conservation score |
|---|---|---|---|---|---|---|---|
| S116 | SAQKSPTSP | NA | -0.847 | -56.9 | 676 | 23,731 | 23.0 |
#The PMID (PubMed Unique Identifier) information of the publication was provided; NA, not available.
3.6 Tumor-related immune infiltration analysis
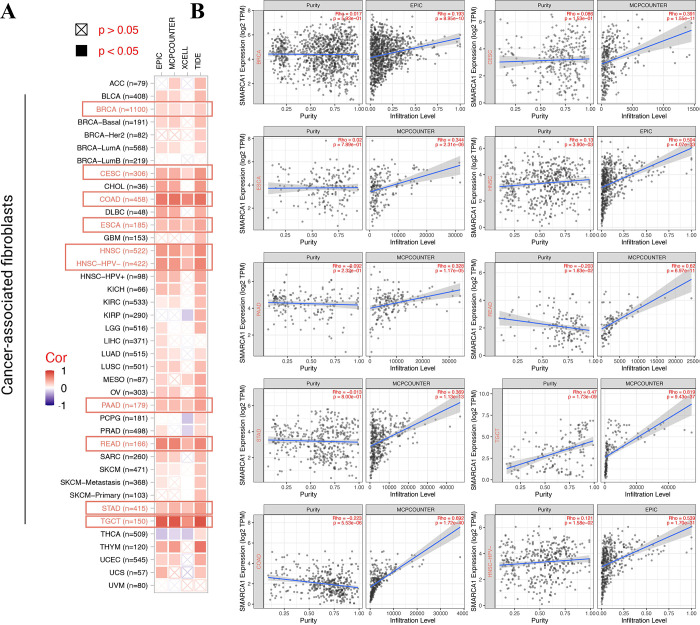
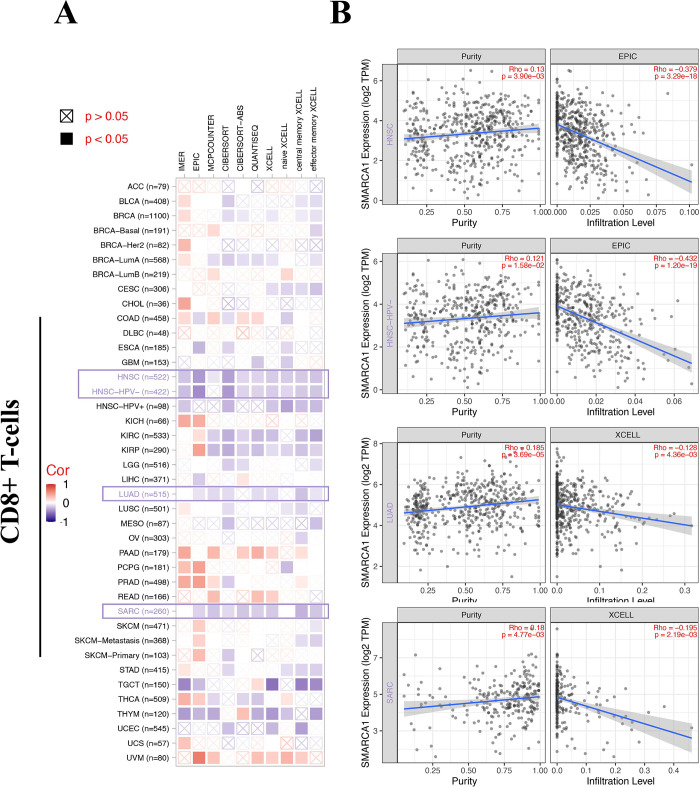
Tumor-related immune infiltration and its association with cancer pathogenesis, progression and metastasis gained increasing interest and focus [ref. 43, ref. 44]. Cancer-associated fibroblasts were considered a significant component of the tumor-immunity microenvironment, exhibiting functions such as matrix remodeling, signal interaction and immune infiltration interfering [ref. 45–ref. 48]. Therefore, we used QUANTISEQ, TIMER, MCPCOUNTER, XCELL, CIBERSORT, CIBERSORT-ABS, TIDE and EPIC algorithms to assess the correlation between SMARCA1 expression and the immune infiltration level of different cell types in various of TCGA cancers. We found a statistically significant positive relationship between SMARCA1 and the estimated value of cancer-associated fibroblasts infiltration for BRCA, CESC, COAD, ESCA, HNSC, HNSC-HPV–, PAAD, READ, STAD and TGCT (Fig 10A, P < 0.05) based on all the algorithms. In contrast, a negative relationship was observed between CD8+ T-cells infiltration and SMARCA1 expression for HNSC, HNSC-HPV–, LUAD and SARC (Fig 11A, P < 0.05) with most algorithms [ref. 24, ref. 49, ref. 50]. We also produced scatterplots of the above cancers with the most effective algorithm (Figs 10B, 11B).
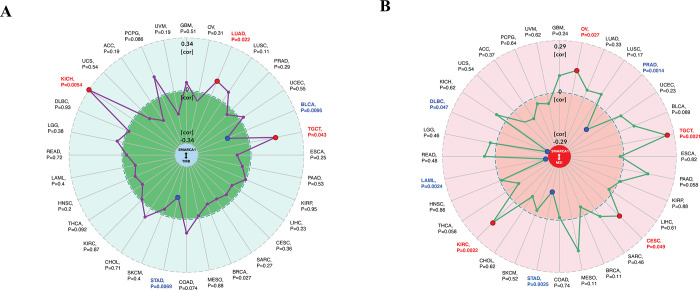
Furthermore, we explored the relationship between SMARCA1 and tumor mutational burden (TMB) / microsatellite instability (MSI), which were used for the prediction of immunotherapy efficacy [ref. 51, ref. 52]. All the cancers in TCGA were analyzed and results presented in Fig 12. SMARCA1 expression was positively correlated with TMB for KICH (P = 0.0054), LUAD (P = 0.022) and TCGT (P = 0.043) but negatively for BLCA (P = 0.0066) and STAD (P = 0.0069) (Fig 12A). We also observed a positive relationship between SMARCA1 and MSI for OV (P = 0.027), TGCT (P = 0.0021), CESC (P = 0.049) and KIRC (P = 0.0022), but negative for PRAD (P = 0.0014), STAD (P = 0.0025), LAML (P = 0.0024) and DLBC (P = 0,047) (Fig 12B). This aspect needs further research.
3.7 Enrichment analysis of SMARCA1-related genes
For an in-depth exploration of the SMARCA1 molecular mechanism in oncogenicity, we tried to sift out the targeted SMARCA1-interacted genes and SMARCA1-correlated genes for a set of signal pathway enrichment analyses. We acquired 50 SMARCA1-binding proteins certificated by experimental evidence via the STRING instrument and constructed an interaction network diagram of them (Fig 13A) [ref. 38]. We then used the “similar genes detection” module of GEPIA2 to obtain the top 100 SMARCA1 expression-correlated genes based on tumor types in TCGA. Generally, the top 5 selected genes exhibited a substantial positive reverence to SMARCA1 in most cancer types in a heatmap (Fig 13B) [ref. 24, ref. 49, ref. 50]. Scatterplots showed a strong positive correlation between SMARCA1 expression and dynein light chain 2 (DYNLL2) (R = 0.50), empfindlicher im dunkelroten licht1 (EID1) (R = 0.52), G protein-coupled receptor associated sorting protein 2 (GPRASP2) (R = 0.52), microtubule-associated protein 9 (MAP9) (R = 0.51), oculocerebrorenal syndrome of Lowe (OCRL) (R = 0.54) genes (all P < 0.001) (Fig 13C).
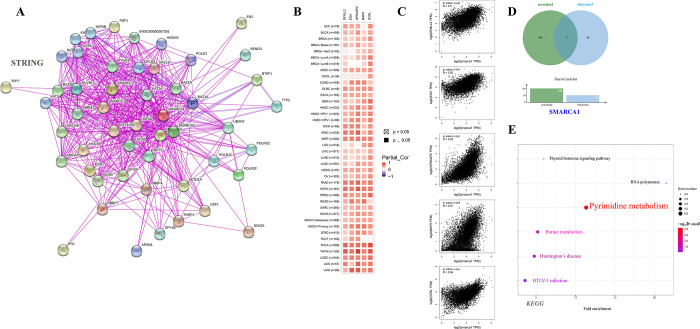
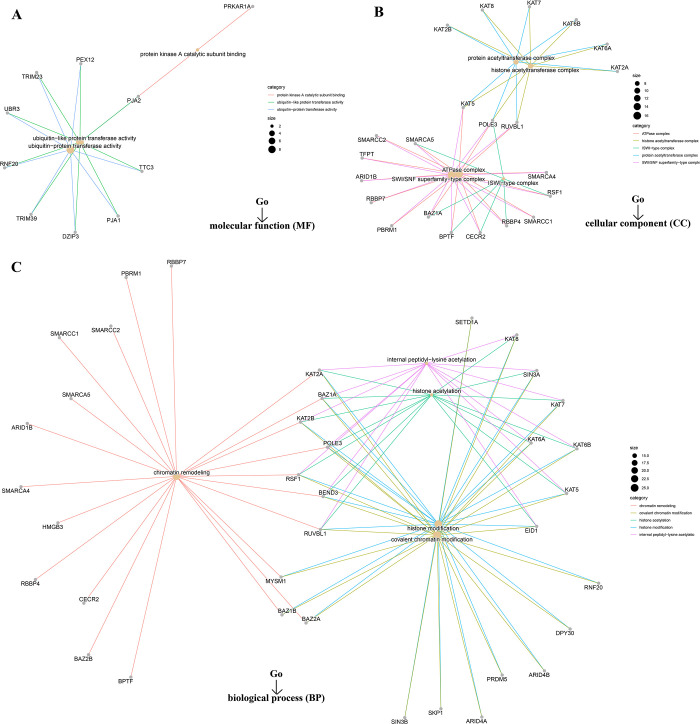
However, we failed to screen out the common member genes from an intersection analysis of the two groups above (Fig 13D). We conducted KEGG and Go enrichment analyses by combining the two datasets. The KEGG plot suggested that “pyrimidine metabolism” and “purine metabolism” might be the main pathways involved in SMARCA1 oncogenicity (Fig 13E) [ref. 40, ref. 41, ref. 53–ref. 55]. The Go enrichment analyses further predicted the intimate connection between most of these genes and the pathway or biological progress of chromatin remodeling, including ubiquitin-protein transferase activity, SWI/SNF superfamily-type complex, histone acetyltransferase complex, covalent chromatin modification and others (Fig 14).
3.8 Diagnostic capability analysis
Through the comprehensive analysis, we discovered that SMARCA1 had good diagnostic performance on 29 cancers, especially on OV (AUC = 0.981), LAML (AUC = 0.935), DLBC (AUC = 0.970), CESC (AUC = 0.846), READ (AUC = 0.802), COAD (AUC = 0.807), LGG (AUC = 0.938), THYM (AUC = 0.992), PAAD (AUC = 0.898), GBM (AUC = 0.838) and TGCT (AUC = 0.910) (S5 Fig).
4. Discussion
As reported in prior studies, the main functions of SMARCA1 protein are focused on chromatin structure alteration and transcriptional activation across a wide range of species [ref. 6–ref. 11, ref. 56, ref. 57]. Our study demonstrated structure conservation of SMARCA1 translation products across several species through the “HomoloGene” database and phylogenetic tree analysis, indicating that similar biological mechanisms of SMARCA1 might operate in the regular physiological activity across each species. Apart from the potential correlation between SMARCA1 and different diseases, especially cancer [ref. 15–ref. 19] were revealed by numerous studies. Whether SMARCA1 could play an essential role in the carcinogenesis of different cancers through established or undiscovered molecular mechanisms is yet to be determined. At the time of writing, to the best of our knowledge, no pan-cancer analysis of SMARCA1 has been reported in published literature. Hence, we thoroughly evaluated the SMARCA1 gene across all cancers based on several databases including TCGA, GEO, CPTAC and more. The molecular characteristic, survival prognosis, genetic mutation, DNA methylation, protein phosphorylation, immune infiltration, signal pathway and diagnostic value were analyzed.
The expression of SMARCA1 varied with each tumor, and so did diagnosis and prognosis, which probably indicates different tumorigenic mechanisms existed in different cancers. SMARCA1 was previously reported to play a vital role in the maturation of midbrain dopaminergic (mDA) neurons [ref. 58] and is related with multiple mechanisms in neurogenesis or schizophrenia [ref. 15]. Although it was considered to be correlated with neurodevelopmental disorders, t a lack of studies specially focused on the brain and central neural system (CNS) cancers. This study attempted to use several tools to assess the correlation between SMARCA1 expression and CNS malignant tumors. Despite our failure to find significant differences based on data in the TIMER2 database, we found that SMARCA1 expression was much higher in tumor tissues than in normal tissues in GBM and LGG based on the GEPIA2 data (combined TCGA and GTEx database) (P < 0.001). This inconsistency might be due to the insufficient normal tissues for control in TIMER2. Up on further analysis of prognosis, we found that higher expression of SMARCA1 was correlated with poor OS (P = 0.036) and DFS (P = 0.035) in LGG, but was not statistically significant in GBM (Fig 5). Similar results were found by OncoLnc (http://www.oncolnc.org), with Cox regression survival analysis on LGG (Cox coefficient = 0.373, P = 1.10e-04) and GBM (Cox coefficient = -0.075, P = 4.20e-01). Additionally, the correlation between SMARCA1 and brain and CNS cancer was verified again via the Oncomine database (P = 7.64e-06) (Fig 3B). Great diagnostic value of SMARCA1 was observed in both cancers (S5 Fig). We observed an unexpected association between reduced DNA methylation levels at three sites in the non-promoter region and high expression of SMARCA1 in LGG (Fig 9A). Consequently, the potential mechanisms of DNA methylation and related upstream or downstream pathways remain to be explored and other CNS tumors deserve to be included in any future investigations.
For lung carcinoma, we used TIMER2 to analyze the datasets of TCGA-LUAD (n = 515) and TCGA-LUSC (n = 501) projects and obtained completely opposite results. High SMARCA1 expression in tumor tissues of LUAD was related to poor OS (P = 0.009) and DFS (P = 0.037) (Fig 5). Nevertheless, low SMARCA1 expression in tumor tissues of LUSC conversely correlated with a better DFS (P = 0.013). Furthermore, we analyzed lung adenocarcinoma (n = 865) and squamous cell carcinoma (n = 675) cases from all cohorts, revealing that low SMARCA1 expression was correlated with poor OS, FP and PPS in LUAD, however high expression was associated with poor FP in LUSC (Table 3). The inconsistent in LUAD might due to the sample size and as a result, the opposite role of SMARCA1 in patient prognosis with different lung cancer histopathology needs further investigation with more extensive sample size studies.
SMARCA1 expression has been found to be correlated with liver cancer in a few studies. Therefore, we conducted a series of statistical analyses to examine this relationship. Based on TIMER2 analysis, SMARCA1 expression was high in tumor tissues of LIHC but low in cholangiocarcinoma (CHOL). However, there were no significant differences between SMARCA1 expression and prognosis in liver cancer based on GEPIA2, OncoLnc, and Kaplan-Meier plotter approaches. Although it could be affected by heterogeneity, model, effect size, sample size, bias, etc., the meta-analysis indicated a potentially high risk of poor prognosis in liver cancer with elevated SMARCA1 expression to (P = 0.021). After analyzing the subgroups of LIHC, we found that female patients with high SMARCA1 expression had poor OS, PFS, RFS and DSS (Table 5), indicating that gender might be a potential risk factor. Although big data cannot give sufficient evidence to support the tumor oncogenic role of SMARCA1 in the prognosis of LIHC as yet, further studies might influence the results.
Down-regulated SMARCA1 might contribute to DNA injury, growth restriction and tumor cell apoptosis in breast cancer [ref. 59] were previously reported, without providing prognosis analysis and other bioinformation. Our study discovered that a low expression of SMARCA1 was correlated with poor OS, RFS and DMFS in breast cancer based on large sample sizes. However, SMARCA1 protein expression was unexpectedly elevated in tumor tissues. The findings may have been affected by the small sample size of the control group. Extensive sample size studies are needed. Many potential mechanisms intervening the process of RNA to protein should also be considered. Although no significant independent risk factors in subgroups were identified (Table 1), low SMARCA1 expression was generally considered a potential risk indicator related to the poor prognosis of BRCA.
For gastrointestinal tumors, up-regulated SMARCA1 expression was considered to be correlated with colorectal and gastric cancer through different pathways [ref. 17, ref. 18]. Interestingly, higher SMARCA1 expression was associated with better DFS based on the GEPIA2 database regardless of the low expression of SMARCA1 in tumor tissues of COAD verified by TIMER2 and Oncomine. Since there were more normal tissues in the GEPIA2 control sample, this may have introduced inconsistencies in the results. Unlike COAD, we observed a consistent relationship between elevated SMARCA1 expression and poor prognosis of STAD across the different databases which indicates that SMARCA1 might be an independent risk factor for STAD. Consequently, the cause of this inconsistency in COAD remains ambiguous.
A similar phenomenon was observed in ovarian cancer: transcriptional SMARCA1 expression was low in tumor tissues accompanied by a high protein expression, with the increased expression correlating with poor OS, PFS, and PPS of OV. These inconsistent conclusions might also be due to the different sample size, data resources and underlying interference mechanisms at the translation level. Chemotherapy regimens might play a critical role in the SMARCA1-related prognosis (Table 2). Although our study discovered that high expression of SMARCA1 is related to poor prognosis of OV, factors contributing to a difference in transcriptional and translational expression need further investigation.
Our analysis of genitourinary cancer achieved comparatively consistent conclusions. The poorer prognosis of KIRC, KIRP, KICH and UCEC were correlated with lower expression of SMARCA1, which was also down-regulated in tumor tissues, indicating that low SMARCA1 expression might be an independent risk factor for genitourinary. Due to insufficient TGCT data, we only evaluated SMARCA1 expression and DNA methylation. SMARCA1 expression levels were low in tumor tissues whereas results from the DNA methylation level analysis showed that two sites (cg08617833and cg24447042) in the promoter region were negatively correlated with SMARCA1 expression. However, another two sites (cg04596655 and cg18751555) in the non-promoter region were positively associated with SMARCA1 expression. This suggests that, some molecular biomarkers or pathways are involved in the progression of SMARCA1 expression and need further evaluation.
In our study, we first explored the potential association between SMARCA1 expression and TMB/MSI across all tumors in TCGA, which needs clinical evidence to verify and validate. We then combined the bioinformation on SMARCA1-associated components and correlated genes covering all cancers for a chain of enrichment analyses to identify the critical role of “pyrimidine/purine metabolism pathways”, “chromatin remodeling and modification” and “ubiquitin-protein transferase activity” in oncogenicity of carcinomas. Furthermore, applying multiple deconvolution algorithms helped us obtain a statistically significant positive correlation between SMARCA1 and cancer-associated fibroblasts in BRCA, CESC, COAD, ESCA, head and neck squamous cell carcinoma (HNSC), HNSC-HPV–, PAAD, READ, STAD and TGCT. Using the same methods, we obtained a statistically significant negative correlation between SMARCA1 and CD8+ T-cells immune-infiltration in the cancers of HNSC, HNSC-HPV–, LUAD and SARC. This indicated that SMARCA1 expression might play a critical role in certain cancers through unknown mechanisms.
We also estimated the correlation between SMARCA1 DNA methylation and protein phosphorylation concerning different neoplasms. Due to insufficient relevant studies on the subject matter, we only observed a significant correlation between DNA methylation in LAML, DLBC, LGG and TGCT and phosphorylation at the S116 site in LUAD and UCEC without subsequent analyses of other biological information. Although the information we revealed was limited, the study still indicated that DNA methylation was related to potential sites and types of carcinomas, providing a direction for further research to some extent.
There are several limitations in our study. First, the SMARCA1 gene was not at the frontier of research, this restricted the relevant studies on it. Little attention has been paid to some types of cancers, this has resulted in limited sample sizes for those cancers which has a negative impact on the findings. Secondly, although we used plenty of databases and tools to elaborate on the role of SMARCA1 on tumorigenesis in many cancers, some of them were still unwell defined, primarily attributing to data updates being out of sync or to each database performing a singular function. We did not conduct the experiments or analyze the clinical data to provide a more concrete basis for the conclusions owing to the massiveness of the data required to complete the experimentation. Such experimentation is not feasible for a single center. Furthermore, as a bioinformatic analysis, although the batch effect of samples and cross-platforms had been corrected by ComBat, the potential interference was common and difficult to completely eliminate. In addition, we did not conduct an in-depth analysis of tumor-related immune infiltration and PPI due to space constrains. Although the analysis was insufficient, it is still meaningful in guiding future research direction to some extent.
SMARCA gene and its subsets play a dominant role in chromatin remodeling and restoration, whose deficiency might induce several malignancies [ref. 60]. Following this viewpoint, we integrated the big data of SMARCA1 gene expression, associated diagnosis, prognosis, genetic mutation, DNA methylation, protein phosphorylation, tumor-related immune infiltration, TMB and MSI across a spectrum of cancers to conduct a pan-cancer analysis and determine the potential correlations among them. Although there are some contradictory results, our study contributes to an initial understanding of the function and role of SMARCA1 in oncogenicity. It points out the direction of further prospective research that can provide much need insight and resolve outstanding inconsistencies.
Supplementary Materials
- Correlation between SMARCA1 and different disorders and cancers.The reported pathogenic pathways mediated by SMARCA1 in different disorders and cancers are displayed in a graphic manner. The relevant references are included.(TIF) (TIF)
- A flowchart for methods and materials.(PDF) (PDF)
- Structural characteristics of SMARCA1 in different species.(A) Genomic location of human SMARCA1; (B) Conserved domains of SMARCA1 protein among diverse species.(TIF) (TIF)
- Phylogenetic tree of SMARCA1.We obtained the phylogenetic tree of SMARCA1 in different species via COBALT of NCBI. COBALT, constraint-based multiple alignment tool.(TIF) (TIF)
- Diagnostic value of SMARCA1 among pan-cancer via TCGA + GTEx.SMARCA1 had different diagnostic abilities in different tumors. AUC, area under curve. * P < 0.05, ** P < 0.01, *** P < 0.001.(PDF) (PDF)
- (ZIP) (ZIP)
References
- A Blum, P Wang, JC Zenklusen. SnapShot: TCGA-Analyzed Tumors.. Cell., 2018. [DOI | PubMed]
- K Tomczak, P Czerwińska, M Wiznerowicz. The Cancer Genome Atlas (TCGA): an immeasurable source of knowledge.. Contemp Oncol (Pozn)., 2015. [DOI | PubMed]
- Z Zhang, H Li, S Jiang. A survey and evaluation of Web-based tools/databases for variant analysis of TCGA data.. Brief Bioinform., 2019. [DOI | PubMed]
- GTEx project maps wide range of normal human genetic variation: A unique catalog and follow-up effort associate variation with gene expression across dozens of body tissues.. Am J Med Genet A., 2018. [DOI | PubMed]
- DR Rhodes, S Kalyana-Sundaram, V Mahavisno. Oncomine 3.0: genes, pathways, and networks in a collection of 18,000 cancer gene expression profiles.. Neoplasia., 2007. [DOI | PubMed]
- A Eberharter, PB Becker. ATP-dependent nucleosome remodelling: factors and functions.. J Cell Sci., 2004. [DOI | PubMed]
- LR Goodwin, DJ Picketts. The role of ISWI chromatin remodeling complexes in brain development and neurodevelopmental disorders.. Mol Cell Neurosci., 2018. [DOI | PubMed]
- KA Giles, CM Gould, Q Du. Integrated epigenomic analysis stratifies chromatin remodellers into distinct functional groups.. Epigenetics Chromatin., 2019. [DOI | PubMed]
- KE Neely, JL Workman. The complexity of chromatin remodeling and its links to cancer.. Biochim Biophys Acta., 2002. [DOI | PubMed]
- F Lopes, M Barbosa, A Ameur. Identification of novel genetic causes of Rett syndrome-like phenotypes.. J Med Genet., 2016. [DOI | PubMed]
- B Zheng, Q Chen, C Wang. Whole-genome sequencing revealed an interstitial deletion encompassing OCRL and SMARCA1 gene in a patient with. Lowe syndrome. Mol Genet Genomic Med., 2019. [DOI | PubMed]
- SK Hota, SK Bhardwaj, S Deindl. Nucleosome mobilization by ISW2 requires the concerted action of the ATPase and SLIDE domains.. Nat Struct Mol Biol., 2013. [DOI | PubMed]
- F Mueller-Planitz, H Klinker, J Ludwigsen. The ATPase domain of ISWI is an autonomous nucleosome remodeling machine.. Nat Struct Mol Biol., 2013. [DOI | PubMed]
- G Euskirchen, RK Auerbach, M Snyder. SWI/SNF chromatin-remodeling factors: multiscale analyses and diverse functions.. J Biol Chem., 2012. [DOI | PubMed]
- OR Homann, K Misura, E Lamas. Whole-genome sequencing in multiplex families with psychoses reveals mutations in the SHANK2 and SMARCA1 genes segregating with illness.. Mol Psychiatry., 2016. [DOI | PubMed]
- PA Patil, K Lombardo, A Sturtevant. Loss of Expression of a Novel Chromatin Remodeler SMARCA1 in Soft Tissue Sarcoma.. J Cytol Histol., 2018. [DOI | PubMed]
- T Liu, Z Han, H Li. LncRNA DLEU1 contributes to colorectal cancer progression via activation of KPNA3.. Mol Cancer., 2018. [DOI | PubMed]
- L Ding, Y Zhao, S Dang. Circular RNA circ-DONSON facilitates gastric cancer growth and invasion via NURF complex dependent activation of transcription factor SOX4.. Mol Cancer., 2019. [DOI | PubMed]
- A Maurer, N Ortiz-Bruechle, K Guricova. Comparative genomic profiling of glandular bladder tumours.. Virchows Arch., 2020. [DOI | PubMed]
- M Haeussler, AS Zweig, C Tyner. The UCSC Genome Browser database: 2019 update.. Nucleic Acids Res., 2019. [DOI | PubMed]
- Database resources of the National Center for Biotechnology Information.. Nucleic Acids Res., 2016. [DOI | PubMed]
- JS Papadopoulos, R Agarwala. COBALT: constraint-based alignment tool for multiple protein sequences.. Bioinformatics., 2007. [DOI | PubMed]
- PJ Thul, C Lindskog. The human protein atlas: A spatial map of the human proteome.. Protein Sci., 2018. [DOI | PubMed]
- T Li, J Fu, Z Zeng. TIMER2.0 for analysis of tumor-infiltrating immune cells.. Nucleic Acids Res., 2020. [DOI | PubMed]
- Z Tang, B Kang, C Li. GEPIA2: an enhanced web server for large-scale expression profiling and interactive analysis.. Nucleic Acids Res., 2019. [DOI | PubMed]
- DS Chandrashekar, B Bashel, SAH Balasubramanya. UALCAN: A portal for facilitating tumor subgroup gene expression and survival analyses.. Neoplasia., 2017. [DOI | PubMed]
- F Chen, DS Chandrashekar, S Varambally. Pan-cancer molecular subtypes revealed by mass-spectrometry-based proteomic characterization of more than 500 human cancers.. Nat Commun., 2019. [DOI | PubMed]
- Á Nagy, A Lánczky, O Menyhárt. Validation of miRNA prognostic power in hepatocellular carcinoma using expression data of independent datasets.. Sci Rep. 2018 Jun 15;. [DOI | PubMed]
- E Clough, T Barrett. The Gene Expression Omnibus Database.. Methods Mol Biol., 2016. [DOI | PubMed]
- C Zhang, J Bijlard, C Staiger. Systematically linking tranSMART, Galaxy and EGA for reusing human translational research data.. F1000Res., 2017. [DOI | PubMed]
- S Shim, BH Yoon, IS Shin. Network meta-analysis: application and practice using Stata.. Epidemiol Health., 2017. [DOI | PubMed]
- P Unberath, C Knell, HU Prokosch. Developing New Analysis Functions for a Translational Research Platform: Extending the cBioPortal for Cancer Genomics.. Stud Health Technol Inform., 2019. [PubMed]
- J Gao, BA Aksoy, U Dogrusoz. Integrative analysis of complex cancer genomics and clinical profiles using the cBioPortal.. Sci Signal., 2013. [DOI | PubMed]
- E Cerami, J Gao, U Dogrusoz. The cBio cancer genomics portal: an open platform for exploring multidimensional cancer genomics data.. Cancer Discov., 2012. [DOI | PubMed]
- A Koch, J Jeschke, W Van Criekinge. MEXPRESS update 2019.. Nucleic Acids Res., 2019. [DOI | PubMed]
- Z Qiao, K Shiozawa, T Kondo. Proteomic approach toward determining the molecular background of pazopanib resistance in synovial sarcoma.. Oncotarget., 2017. [DOI | PubMed]
- R Bonneville, MA Krook, EA Kautto. Landscape of Microsatellite Instability Across 39 Cancer Types.. JCO Precis Oncol., 2017. [DOI | PubMed]
- D Szklarczyk, JH Morris, H Cook. The STRING database in 2017: quality-controlled protein-protein association networks, made broadly accessible.. Nucleic Acids Res., 2017. [DOI | PubMed]
- P Bardou, J Mariette, F Escudié. jvenn: an interactive Venn diagram viewer.. BMC Bioinformatics., 2014. [DOI | PubMed]
- DW Huang, BT Sherman, RA Lempicki. Systematic and integrative analysis of large gene lists using DAVID Bioinformatics Resources.. Nature Protoc., 2009. [DOI | PubMed]
- DW Huang, BT Sherman, RA Lempicki. Bioinformatics enrichment tools: paths toward the comprehensive functional analysis of large gene lists.. Nucleic Acids Res., 2009. [DOI | PubMed]
- BKC Chan. Data Analysis Using R Programming.. Adv Exp Med Biol., 2018. [DOI | PubMed]
- T Kikuchi, K Mimura, M Ashizawa. Characterization of tumor-infiltrating immune cells in relation to microbiota in colorectal cancers.. Cancer Immunol Immunother., 2020. [DOI | PubMed]
- A Steven, B Seliger. The Role of Immune Escape and Immune Cell Infiltration in Breast Cancer.. Breast Care (Basel)., 2018. [DOI | PubMed]
- E Sahai, I Astsaturov, E Cukierman. A framework for advancing our understanding of cancer-associated fibroblasts.. Nat Rev Cancer., 2020. [DOI | PubMed]
- Y Miyai, N Esaki, M Takahashi. Cancer-associated fibroblasts that restrain cancer progression: Hypotheses and perspectives.. Cancer Sci., 2020. [DOI | PubMed]
- X Chen, E Song. Turning foes to friends: targeting cancer-associated fibroblasts.. Nat Rev Drug Discov., 2019. [DOI | PubMed]
- MQ Kwa, KM Herum, C Brakebusch. Cancer-associated fibroblasts: how do they contribute to metastasis?. Clin Exp Metastasis., 2019. [DOI | PubMed]
- Taiwen Li, Jingyu Fan, Binbin Wang, Nicole Traugh, Qianming Chen, Jun S. Liu. TIMER: A web server for comprehensive analysis of tumor-infiltrating immune cells.. Cancer Research., 2017. [DOI | PubMed]
- Bo Li, Eric Severson, Jean-Christophe Pignon, Haoquan Zhao, Taiwen Li, Jesse Novak. Comprehensive analyses of tumor immunity: implications for cancer immunotherapy.. Genome Biology., 2016. [DOI | PubMed]
- TA Chan, M Yarchoan, E Jaffee. Development of tumor mutation burden as an immunotherapy biomarker: utility for the oncology clinic.. Ann Oncol., 2019. [DOI | PubMed]
- L Chang, M Chang, HM Chang. Microsatellite Instability: A Predictive Biomarker for Cancer Immunotherapy.. Appl Immunohistochem Mol Morphol., 2018. [DOI | PubMed]
- M. Kanehisa, S. Goto. ; KEGG: Kyoto Encyclopedia of Genes and Genomes.. Nucleic Acids Res., 2000. [DOI | PubMed]
- M Kanehisa. Toward understanding the origin and evolution of cellular organisms.. Protein Sci., 2019. [DOI | PubMed]
- M. Kanehisa, M. Furumichi, Y. Sato, M. Ishiguro-Watanabe, M. Tanabe. KEGG: integrating viruses and cellular organisms.. Nucleic Acids Res., 2021. [DOI | PubMed]
- J Yuan, G Ghosal, J Chen. The HARP-like domain-containing protein AH2/ZRANB3 binds to PCNA and participates in cellular response to replication stress.. Mol Cell., 2012. [DOI | PubMed]
- SF Wu, H Zhang, BR Cairns. Genes for embryo development are packaged in blocks of multivalent chromatin in zebrafish sperm.. Genome Res., 2011. [DOI | PubMed]
- E Metzakopian, K Bouhali, M Alvarez-Saavedra. Genome-wide characterisation of Foxa1 binding sites reveals several mechanisms for regulating neuronal differentiation in midbrain dopamine cells.. Development., 2015. [DOI | PubMed]
- Y Ye, Y Xiao, W Wang. Inhibition of expression of the chromatin remodeling gene, SNF2L, selectively leads to DNA damage, growth inhibition, and cancer cell death.. Mol Cancer Res., 2009. [DOI | PubMed]
- R Chetty, S Serra. SMARCA family of genes.. J Clin Pathol., 2020. [DOI | PubMed]