Comparative Study on the Effects of Four Plant Protein Sources on the Liver and Intestinal Health of Largemouth Bass, Micropterus salmoides
Abstract
The effects of plant protein sources (PPSs) on the health of the liver and intestine of the largemouth bass, Micropterus salmoides, were compared to verify the potential damaging effects of dietary fiber (DF). A diet containing 55% fish meal (FM) was used as the control. The test diets contained 25% soybean meal (SBM), rapeseed meal (RSM), cottonseed meal, or peanut meal, and the FM content was decreased to 30%. The protein and lipid contents of these five diets were balanced by casein and oil. Fish were raised for 8 weeks. The fish fed the diet containing PPS showed a trend of decreasing growth and apparent digestibility coefficients. The contents of total bile acid, lipid, and collagen in the liver were increased, and the mRNA expression levels of genes encoding inflammatory factors and enzymes involved in de novo fatty acid synthesis and bile acid synthesis were upregulated. Both the lipid and collagen contents in the liver were positively correlated with the DF content in the diet significantly. Morphology and histology showed reduced liver size, hepatic steatosis, and fibrosis in fish fed diets containing PPS. The lowest hepatosomatic index was observed in fish fed the SBM diet, and the most severe damage was observed in fish fed the RSM diet. No obvious histological abnormalities were observed in the hindgut. The bile acid profile in the liver could be used to distinguish the types of PPS very well by Fisher discriminant analysis. These results indicated that 25% of each of the four PPSs in the diet exceeded the tolerance range of largemouth bass and caused liver damage, which might be mediated by bile acid. DF in PPS might be an important agent contributing to liver damage.
Affiliations: Key Laboratory of Aquatic Animal Nutrition of Jiangsu, School of Biology and Basic Medical Sciences, Soochow University, Suzhou 215123, China
License: Copyright © 2024 Shibin Yao et al. CC BY 4.0 This is an open access article distributed under the Creative Commons Attribution License, which permits unrestricted use, distribution, and reproduction in any medium, provided the original work is properly cited.
Article links: DOI: 10.1155/2024/6337005 | PubMed: 38298207 | PMC: PMC10830314
Relevance: Moderate: mentioned 3+ times in text
Full text: PDF (4.3 MB)
1. Introduction
With the successful application of formula feed, the aquaculture production of the largemouth bass, Micropterus salmoides, has been rapidly increasing in China during the past decade. However, the incidence of diseases, such as fatty liver and enteritis, is also gradually increasing. Previous studies have shown that growth retardation [ref. 1], fatty liver [ref. 2], and enteritis [ref. 3, ref. 4] could be induced in different fish species, including largemouth bass, when the diet contains a high level of plant protein sources (PPSs) [ref. 5, ref. 6]. However, the pathogenic agent is still unclear.
PPSs are rich in dietary fiber (DF), which refers to nondigestible carbohydrates with polymerization degrees ≥3, such as nonstarch polysaccharides, resistant starch, resistant maltodextrins, fructo-oligosaccharides, and galacto-oligosaccharides [ref. 7, ref. 8]. The optimum DF level could alleviate fatty liver [ref. 9] and improves gut health [ref. 10, ref. 11] in humans and animals, including fish species [ref. 12]. However, studies in recent years have also suggested that the health benefits of DF need to be redefined [ref. 13], as DF could induce cholestasis, hepatic inflammation, and liver cancer, which is microbiota-dependent and transmissible [ref. 14]. In fish, it was also observed that high levels of DF induced cholestasis, hepatic steatosis and fibrosis, and enteritis [ref. 15, ref. 16]. These studies suggested that DF in PPS might contribute to the abovementioned fatty liver and enteritis. The type and level of DF varied among different PPS, which indicates that the impact on fish health should be different.
Soybean meal (SBM), rapeseed meal (RSM), cottonseed meal (CSM), and peanut meal (PNM) are often used to replace fish meal (FM) in aquatic formula feed to cope with the shortage of FM due to their accessibility, affordability, and high protein content [ref. 17, ref. 18]. The DF content in these four PPSs is more than 30% [ref. 19–ref. 22]. In this study, the effects of 25% of these four PPSs in the diet on the health of the liver and gut of largemouth bass were assessed. The results revealed that all four PPSs can cause different degrees of liver tissue damage accompanied by a disorder of bile acid (BA) homeostasis, with RSM being the worst. These results are useful for understanding feeding-induced health damage as well as feed optimization.
2. Materials and Methods
2.1. Diets
Except for casein, dextrin, and yttrium oxide, which were analytical reagents, all the other feedstuffs were provided by Guangdong Yuehai Feed Co., Ltd. The feed ingredients were fully ground and screened with an 80 mesh sieve, and the undersize was collected. The approximate compositions of FM, SBM, RSM, CSM, and PNM were analyzed, and the results are shown in Table 1. A diet containing 55% FM was used as the control. The test diets contained 25% SBM, RSM, CSM, and PNM, and the percentage of FM was decreased to 30%. The 25% PPS was high enough to induce adverse effects on liver health in largemouth bass according to Weng et al. [ref. 23] and our previous study when FM was less than 30%. The protein and lipid contents of the five diets were balanced by casein and oil. Each ingredient was weighed according to the formula, mixed evenly, and then pelletized into particles of 1.0 mm in diameter. After drying, the pellets were stored at −20°C. The formulas of the five diets are shown in Table 2.
Table 1: Approximate composition of the main protein ingredients used in this study (g/kg air-dry basis).
| Composition | FM | SBM | RSM | CSM | PNM |
|---|---|---|---|---|---|
| Moisture | 101 | 115 | 108 | 89 | 112 |
| Protein | 669 | 430 | 379 | 519 | 528 |
| Lipid | 88 | 17 | 17 | 14 | 15 |
| Ash | 169 | 68 | 75 | 64 | 59 |
| Total dietary fiber | 4 | 361 | 392 | 303 | 278 |
| Soluble dietary fiber | 2 | 53 | 49 | 33 | 31 |
Table 2: Formulation and approximate composition of the experimental diets.
| FM | SBM | RSM | CSM | PNM | |
|---|---|---|---|---|---|
| Ingredients (g/kg air-dry basis) | |||||
| Fish meal | 550 | 300 | 300 | 300 | 300 |
| Soybean meal | — | 250 | — | — | — |
| Rapeseed meal | — | — | 250 | — | — |
| Cottonseed meal | — | — | — | 250 | — |
| Peanut meal | — | — | — | — | 250 |
| Casein | 60 | 130 | 144 | 104 | 101 |
| Fish oil | 0 | 22 | 22 | 22 | 22 |
| Soybean oil | 40 | 36 | 36 | 36 | 36 |
| Zeolite power | 104 | 16 | 2 | 42 | 45 |
| Squid paste | 20 | 20 | 20 | 20 | 20 |
| Dextrin | 180 | 180 | 180 | 180 | 180 |
| Monocalcium phosphate | 15 | 15 | 15 | 15 | 15 |
| Premix | 30 | 30 | 30 | 30 | 30 |
| Yttrium oxide | 1 | 1 | 1 | 1 | 1 |
| Total | 1,000 | 1,000 | 1,000 | 1,000 | 1,000 |
| Approximate compositions | |||||
| Moisture | 112 | 113 | 115 | 118 | 114 |
| Protein | 423 | 424 | 418 | 424 | 427 |
| Lipid | 88 | 86 | 84 | 87 | 88 |
| Ash | 191 | 99 | 89 | 115 | 123 |
| Total dietary fiber | 1.2 | 10.1 | 10.8 | 8.8 | 7.9 |
| Soluble dietary fiber | 0.6 | 1.9 | 1.8 | 1.4 | 1.3 |
Note: Premix contains vitamins and minerals. The guarantee values are the same as in the previous literature [16].
2.2. Feeding and Fecal Collection
An 8-week growth trial was conducted at the Postgraduate Workstation of Suzhou Yangcheng Lake National Modern Agricultural Development Co., Ltd. The water used in this experiment was introduced from Yangcheng Lake, precipitated and filtered. Juvenile largemouth bass were provided by a local farm and temporarily raised in an indoor cement pond for 20 days. During this time, fish were fed commercial feed. A total of 330 healthy fish of the same size were distributed evenly among 15 tanks, with 22 fish per tank. Fish were fed the FM diet for one more week to adapt to the trial conditions. Then, in a state of fasting, all fish in each tank were netted, and two fish of proper size were picked out to allow the total weight of the remaining 20 fish to be equal among tanks (CV < 3%). The average body weight was 12.5 g at that time. Fish were then fed the five experimental diets manually in three duplicates, with a random distribution, two times a day (at 8:00 and 17:00) to apparent satiety. As DF-induced damage was microbiota-dependent and transmissible [ref. 14], water was not recycled. The sewage was siphoned at 9:00 everyday, and one-third of the bottom water was discharged. Fresh water was then immediately and gently added. Dead fish (occurring only in the first week) were weighed and substituted by a similar size healthy fish selected from the cement storage pond. The feces were collected everyday from the fourth week and stored at −20°C. During the growth trial, the water temperature was 26∼30°C, the pH was 7.5∼7.9, the DO concentration was > 6.5 mg/l, and the ammonia nitrogen concentration was <0.5 mg/l.
2.3. Sample Collection and Preparation
At the end of the feeding trial, fish were fasted for 24 hr, quickly netted, and anesthetized use 100 ppm MS-222. They were then weighed individually. Three fish were randomly fetched for whole body approximate composition analysis; two fish were dissected. The liver and hindgut tissues were taken and fixed with 3% paraformaldehyde for histopathological analysis. Three fish were sacrificed to sample the liver, which was frozen in liquid nitrogen, stored at −80°C for later gene expression analysis. Blood was drawn from five fish with a heparin sodium-treated syringe from the tail vein. The blood was injected into a 1.5 ml Eppendorf tube, and centrifuged at 4,000 r/min, 4°C for 10 min. Then, plasma was drawn out and stored at −80°C. These fish were further dissected to sample the liver tissue to determine the lipid, collagen, and total BA (TBA) contents. The visceral mass, liver, and gallbladder of all the above fish were weighed to calculate the viscerosomatic index (VSI), hepatosomatic index (HSI), and gallbladder somatic index (GBSI).
2.4. Analysis Methods
2.4.1. Approximate Composition and Yttrium
The moisture in the diet was measured by drying at 105°C and in the whole fish body by a freeze-drier (LGJ-18B). The protein, lipid, and ash in the diet, feces, and whole body were determined by the GB/T 6432-2018, GB/T 6433-2006, and GB/T 6438-2007, respectively. The content of total DF and soluble DF in the diet was determined by the enzymatic–gravimetric method (GB 5009.88-2014). The content of yttrium in the feed and feces was measured with an ICP-ES (PerkinElmer Optima 8000, U.S.), before which the samples of the diet and feces were digested in AR grade HNO3 with a GH08Z-Z microwave digestion instrument (Gaohuan Youke, Qingdao). The approximate composition of the five diets is shown in Table 2.
2.4.2. Plasma Biochemical Indices
Plasma aspartate aminotransferase (AST, aspartate substrate method), alanine aminotransferase (ALT, alanine substrate method), alkaline phosphatase (ALP, NPP Substrate-AMP Buffer Method), total cholesterol (TC, CHOO-PAP substrate method), and triglyceride (TG, GPO-PAP method) levels were determined by a biochemical analyzer (C8000, Abbott Laboratories, USA), the reagent kit was purchased from Ningbo Meikang Biotechnology Co., Ltd.
2.4.3. Liver Lipid, Collagen, TBA Content, and BA Profile
The liver tissue was freeze-dried, and the lipid content was determined by the Soxhlet extraction method, as described above. The TBA content was determined also using the biochemical analyzer (Abbott C8000, U.S.) and the manufacturer of kit was Ningbo Meikang Biotechnology Co., Ltd. The collagen content was determined by a Sanjia Fish COL ELISA Kit (Suzhou, China). The BA profile was determined by the UPLC-QqQ-MS method. Briefly, frozen samples were thawed at 4°C, ground, and mixed evenly. One hundred milligrams of the sample was weighed, and 5 ml of methanol solution (1 : 1) was added. Then, it was shaken for 5 min, sonicated at 4°C for 30 min, incubated at 4°C for 30 min, and centrifuged at 12,000 rpm for 10 min. The supernatant (200 μl) was collected and placed in a 1.5 ml Eppendorf tube. Then, 190 precipitants (methanol : acetonitrile = 1 : 1) were added, and 10 μl methanol (including internal standard 4,000 ng/ml) was added. It was then shaken for 5 min and centrifuged at 12,000 rpm for 10 min. The supernatant was filtered through a 0.22 μm PVDF membrane syringe filter for LC‒MS. Waters Acquity UPLC and AB Sciex 5500-MS were used in the study. A C-18 column (1.7 μm i.d.; 2.1 mm × 100 mm) was used, and the temperature was 40°C. Mobile phase A was water with 0.05% formic acid, whereas phase B was acetonitrile with 0.05% formic acid. The flow rate was 0.45 ml/min. The gradient program used was as follows: 0–1 min, 10% B; 1–2 min, 10%–40% B; 2–5 min, 40%–45% B; 5–7.5 min, 45%–60% B; 7.5–9.5 min, 60%–65% B; 9.5–11.5 min, 65%–80% B; 11.5–13.5 min, 80% B; 13.5–14 min, 80%–10% B; and 14–16 min, 10% B. The injection volume of all samples was 6 μl. All types of BA and their respective sulfates were detected in negative ionization mode with the following mass spectrometer source settings: ion source, ESI; ion spray voltage, 4500 V; source temperature, 450°C; curtain gas, 35 arb; collision gas, 9 arb; ion source gas1, 45 arb; and ion source gas 2, 45 arb. The multiple reaction monitoring transitions for each analyte and MS parameters are shown in Table 3.
Table 3: The condition for bile acid (BA) LC–QqQ–MS analysis and the detected type of BA.
| No. | Compound | Q1 | Q3 | Declusteringpotential | Collisionenergy (eV) | Cell exitpotential | Detected BA |
|---|---|---|---|---|---|---|---|
| 1 | TDCA | 498 | 498 | −67 | −65 | −29 | + |
| 2 | HDCA | 391.4 | 391.4 | −177 | −21 | −6 | + |
| 3 | GUDCA | 448.3 | 74.2 | −144 | −74 | −8 | — |
| 4 | GHDCA | 448.3 | 74.1 | −83 | −77 | −4 | — |
| 5 | DCA | 391.3 | 391.3 | −12 | −14 | −12 | + |
| 6 | TCDCA | 498.3 | 498.3 | −40 | −38 | −10 | + |
| 7 | THDCA | 498.3 | 498.3 | −39 | −11 | −15 | + |
| 8 | GCDCA | 448.4 | 74.1 | −43 | −67 | −9 | — |
| 9 | TCA | 514.2 | 514.2 | −12 | −12 | −15 | + |
| 10 | GDCA | 448.3 | 74.1 | −109 | −77 | −5 | — |
| 11 | TUDCA | 498.4 | 498.4 | −41 | −22 | −15 | + |
| 12 | UDCA | 391.4 | 391.4 | −10 | −14 | −12 | + |
| 13 | CDCA | 391.4 | 391.4 | −25 | −30 | −12 | + |
| 14 | GCA | 464.4 | 74.1 | −20 | −75 | −10 | — |
| 15 | CA | 407.5 | 407.5 | −28 | −15 | −8 | + |
| 16 | GLCA-1 | 432.3 | 74 | −140 | −70 | −9 | + |
| GLCA-2 | 432.3 | 388.4 | −82 | −45 | −12 | — | |
| 17 | apoCA-1 | 389.3 | 371.4 | −194 | −41 | −11 | + |
| apoCA-2 | 389.3 | 59.1 | −56 | −41 | −9 | — | |
| 18 | 7,12-diketoLCA | 401.3 | 401.3 | −225 | −31 | −8 | + |
| 19 | TLCA | 482.3 | 482.3 | −50 | −25 | −14 | + |
| 20 | alloLCA-1 | 375.2 | 75 | −50 | −21 | −9 | + |
| alloLCA-2 | 375.2 | 375.2 | −188 | −17 | −22 | — | |
| 21 | MDCA | 391.4 | 391.4 | −113 | −38 | −24 | + |
| 22 | 12-DHCA | 405.2 | 405.2 | −70 | −39 | −4 | + |
| 23 | LCA | 375.3 | 375.3 | −68 | −32 | −6 | + |
| 24 | TβMCA | 514.2 | 514.2 | −91 | −21 | −4 | + |
| 25 | GDHCA | 458.3 | 73.8 | −202 | −78 | −11 | — |
| 26 | βMCA | 407.2 | 407.2 | −184 | −40 | −8 | + |
| 27 | βHDCA | 391.3 | 391.3 | −128 | −15 | −8 | + |
| 28 | NorCA-1 | 393.3 | 275.3 | −225 | −55 | −19 | + |
| NorCA-2 | 393.3 | 329.3 | −242 | −46 | −19 | — | |
| 29 | βUDCA | 391.4 | 391.4 | −191 | −21 | −26 | + |
| 30 | dehydroLCA | 373.3 | 373.3 | −138 | −39 | −3 | + |
| 31 | isoLCA | 375.3 | 375.3 | −214 | −19 | −7 | + |
| 32 | UCA-1 | 406.9 | 325.3 | −135 | −51 | −33 | + |
| UCA-2 | 406.9 | 343.2 | −90 | −45 | −33 | — | |
| 33 | ACA-1 | 407.3 | 233.1 | −136 | −57 | −13 | + |
| ACA-2 | 407.3 | 361.4 | −141 | −44 | −11 | — | |
| 34 | NorDCA | 377.3 | 377.3 | −184 | −38 | −9 | — |
| 35 | 3-DHCA | 405.3 | 405.3 | −116 | −39 | −4 | — |
| 36 | 6-ketoLCA-1 | 389.2 | 59.1 | −57 | −39 | −10 | + |
| 6-ketoLCA-2 | 389.2 | 371.3 | −179 | −39 | −7 | — | |
| 37 | 7-ketoDCA | 405.1 | 405.1 | −157 | −40 | −8 | + |
| 38 | 12-ketoLCA | 389.4 | 389.4 | −4 | −29 | −13 | + |
| 39 | THCA | 514.3 | 514.3 | −29 | −13 | −30 | + |
| 40 | isoDCA | 391.3 | 391.3 | −58 | −14 | −25 | + |
| 41 | λMCA | 407.3 | 407.3 | −5 | −24 | −25 | + |
| λMCA | 407.3 | 389.3 | −15 | −47 | −20 | — | |
| 42 | aMCA | 407.1 | 407.1 | −17 | −14 | −23 | + |
| 43 | ωMCA | 407.4 | 407.4 | −163 | −17 | −12 | + |
| 44 | CA-D4 | 411.4 | 290 | −200 | −53 | −17 | — |
Note: +means detected BA.
2.4.4. Gene Expression
The mRNA expression levels of cyp7a1, cyp8b1, cyp27a1, fxr, nf-kb1, il-1β, tnf-α, il-10, tgf-β1, lxr, hmgcr, pparα, fas, acc1, and apob in the liver were determined. The primer sequences are shown in Table 4. Total mRNA of liver tissue was extracted with a TRIzol kit (Takara, Suzhou, China). The mRNA concentration was examined with a nucleic acid detector (NanoDrop Lite, Thermo Fisher Scientific) after 1.0% gel electrophoresis. cDNA was synthesized with a PrimeScriptTM RT Master Mix kit, and qRT‒PCR was performed to quantify the relative expression of the target gene (CFX96 Touch, Bio-Rad, U.S.). The program was as follows: predenaturation at 95°C for 30 s; then, 40 amplification cycles at 95°C for 15 s and 60°C for 20 s. The melting cycle was 95°C for 15 s, 60°C for 30 s, and 95°C for 15 s. The amplification efficiency deviation between the target gene and the internal reference gene was less than 5%, and the 2−ΔΔCt method was used to calculate the relative expression of the target gene.
Table 4: Real-Time PCR primer sequences.
| Primer names | (5ʹ‒3ʹ) forward primer | (3ʹ‒5ʹ) reverse primer | Reference |
|---|---|---|---|
| β-actin | ATCGCCGCACTGGTTGTTGAC | CCTGTTGGCTTTGGGGTTC | [ref. 24] |
| cyp7a1 | CTGGGCTTCACAGGCTAACACC | TTCAGTGTGGGGTCGTTGGG | [ref. 25] |
| cyp8b1 | TAGACAGCGGCAACCAGGAG | CCGTGCTTTTGTTTCATCCTATC | [ref. 25] |
| cyp27a1 | ATGCCCGTGTCACTGTTG | GTGCGGCTTGGACTTCTC | [ref. 26] |
| fxr | AGAAATGGCAACAAGTCAA | CACGGTCCAGAGAGAGAAA | [ref. 26] |
| nf-κβ1 | GCTGCTCGTTGTCGTGAATA | CCACTTCACCCCTGATGACT | [ref. 27] |
| il-1β | CGTGACTGACAGCAAAAAGAGG | GATGCCCAGAGCCACAGTTC | [ref. 28] |
| tnf-α | CTTCGTCTACAGCCAGGCATCG | TTTGGCACACCGACCTCACC | [ref. 25] |
| il-10 | CGGCACAGAAATCCCAGAGC | CAGCAGGCTCACAAAATAAACATCT | [ref. 25] |
| tgf-β1 | GCTCAAAGAGAGCGAGGATG | TCCTCTACCATTCGCAATCC | [ref. 25] |
| lxr | ACAGCCCAGATCACTTT | ATGACACCCTCACAGCA | [ref. 29] |
| hmgcr | GGTGGAGTGCTTAGTAATCGG | ACGCAGGGAAGAAAGTCAT | [ref. 26] |
| pparα | CCACCGCAATGGTCGATATG | TGCTGTTGATGGACTGGGAAA | [ref. 25] |
| fas | CAGCCCTTGACTCATTCCG | CGCAGACTACGACCCGACAG | [ref. 30] |
| acc1 | ATCCCTCTTTGCCACTGTTG | GAGGTGATGTTGCTCGCATA | [ref. 31] |
| apob | AGGCTGGGTGTTGTTGATGG | GAGAGCTGAGGGATGTTCTTGTTTAG | [ref. 25] |
Note: β-actin, reference gene; cyp7a1, encodes cholesterol 7 α-hydroxylase; cyp8b1, encodes sterol 12 α-hydroxylase; cyp27a1, encodes cholesterol 27α hydroxylase; fxr, encodes farnesol X receptor; nf-κβ1, encodes nuclear factor kappa β subunit 1; il-1β, encodes interleukin 1 complex; tnf-α, encodes tumor necrosis factor alpha; il-10, encodes interleukin 10; tgf-β1, encodes transforming growth factor-β1; lxr, encodes liver X receptor; hmgcr, encodes 3-hydroxy-3-methylglutaryl-coenzyme A reductase; pparα, encodes peroxisome proliferator-activated receptor alpha; fas, encodes fatty acid synthase; acc1, encodes acetyl CoA carboxylase; and apob, encodes apolipoprotein.
2.4.5. Histology
The liver and hindgut tissues fixed in paraformaldehyde were removed and washed, and then sections were made according to routine procedures. Liver tissue sections were stained with H&E, Masson, and oil red O, and intestinal tissue sections were stained with H&E. An Olympus BX51 microscope and DP72 digital imaging system were used for observation.
2.5. Calculation
Survival, weight gain (WG), specific growth rate (SGR), feed intake (FI), feed conversion ratio (FCR), protein efficiency ratio (PER), VSI, HSI, GBSI, and apparent digestibility coefficients (ADCs) of dietary nutrients were calculated as follows:
2.6. Statistical Analysis
All data were subjected to one-way ANOVA, followed by Duncan’s multiple-range test. Pearson correlation was examined between DF or soluble DF and liver lipid or collagen content. Stepwise (lambda method) discriminant analysis was performed for BA profile data to screen for differential components. Statistical analysis was performed by SPSS Statistics 21.0 (SPSS Inc., USA), and the significance level was set as P < 0.05.
3. Results
3.1. Survival, Growth Performance, and Diet Utilization
No more than two fish died in a small number of tanks, and no fish died after the first week. The survival was higher than 96.67%, and no significant difference was detected in survival among groups (P > 0.05). After feeding for 8 weeks, the FBW, WG, SGR, and PER of all groups fed the diet containing PPS were lower than those of fish fed the FM diet significantly (P < 0.05, Table 5). The fish fed the RSM diet had the worst SGR, which was even lower than that of fish fed the PNM diet (P < 0.05).
Table 5: Effects of four types of plant protein sources on the growth and feed utilization of the largemouth bass, M. salmoides.
| Diets | FM | SBM | RSM | CSM | PNM |
|---|---|---|---|---|---|
| Initial body weight (g/fish) | 12.51 ± 0.06 | 12.49 ± 0.03 | 12.50 ± 0.25 | 12.47 ± 0.07 | 12.51 ± 0.04 |
| Final body weight (g/fish) | 54.94 ± 1.69a | 48.64 ± 0.73bc | 46.30 ± 1.14c | 48.81 ± 2.44bc | 50.09 ± 1.20b |
| Weight gain (%) | 339.43 ± 11.72a | 289.44 ± 5.09bc | 270.58 ± 3.24c | 291.59 ± 21.68bc | 300.47 ± 8.58b |
| Specific growth rate (%/day) | 2.64 ± 0.05a | 2.43 ± 0.02bc | 2.34 ± 0.02c | 2.44 ± 0.10bc | 2.48 ± 0.04b |
| Feed intake (g/fish/day) | 0.83 ± 0.02a | 0.81 ± 0.03b | 0.80 ± 0.02b | 0.82 ± 0.02ab | 0.82 ± 0.01ab |
| Feed conversion ratio | 1.09 ± 0.04b | 1.22 ± 0.07ab | 1.29 ± 0.09a | 1.24 ± 0.05a | 1.19 ± 0.11ab |
| Protein efficiency ratio | 2.12 ± 0.10a | 1.87 ± 0.09b | 1.83 ± 0.02b | 1.88 ± 0.09b | 1.96 ± 0.09b |
| Survival (%) | 100 ± 0.00 | 96.67 ± 2.89 | 100 ± 0.00 | 96.67 ± 2.89 | 96.67 ± 5.77 |
Note: Values in the same row with different letters are significantly different (P < 0.05, n = 3).
3.2. Body Composition
There was no significant difference in the body composition of largemouth bass fed different diets (P < 0.05, Table 6).
Table 6: Effects of four types of plant protein sources on the whole body composition of largemouth bass, M. salmoides.
| Diets (g/kg) | FM | SBM | RSM | CSM | PNM |
|---|---|---|---|---|---|
| Moisture | 694.3 ± 8.7 | 697.0 ± 4.6 | 700.3 ± 4.7 | 695.6 ± 2.3 | 693.3 ± 5.6 |
| Protein | 164.8 ± 3.2 | 163.4 ± 1.1 | 161.1 ± 2.3 | 162.5 ± 0.3 | 158.2 ± 7.0 |
| Lipid | 68.7 ± 2.9 | 67.0 ± 3.6 | 72.8 ± 3.0 | 70.3 ± 6.0 | 70.2 ± 3.6 |
| Ash | 39.9 ± 3.5 | 38.3 ± 2.4 | 38.3 ± 2.5 | 40.0 ± 1.2 | 38.9 ± 2.1 |
3.3. Apparent Digestibility Coefficients
The ADC of dry matter, protein, and lipid in fish fed the diet containing PPS was lower than that fed the FM diet. The statistical analysis showed that the ADC of dry matter and protein of the RSM diet was significantly lower than that of the FM diet and PNM diet (P < 0.05, Table 7), and the ADC of protein of the CSM diet was also significantly lower than that of the FM diet (P < 0.05). No significant difference was detected in the ADC of lipids among the groups (P > 0.05).
Table 7: Effects of four types of plant protein sources on the apparent digestibility coefficients of dry matter, protein, and lipids for largemouth bass, M. salmoides.
| Diets (%) | FM | SBM | RSM | CSM | PNM |
|---|---|---|---|---|---|
| Dry matter | 79.6 ± 0.9a | 78.4 ± 1.6ab | 75.3 ± 2.3b | 76.9 ± 1.5ab | 78.8 ± 1.9a |
| Protein | 91.4 ± 0.8a | 89.3 ± 1.4abc | 87.5 ± 1.9c | 88.8 ± 1.2bc | 90.6 ± 0.9ab |
| Lipid | 93.4 ± 1.0 | 91.1 ± 0.8 | 90.3 ± 2.3 | 91.3 ± 1.1 | 92.3 ± 0.5 |
Note: Values in the same row with different letters are significantly different (P < 0.05, n = 3).
3.4. Plasma Biochemistry
The plasma biochemical indices of largemouth bass changed significantly in fish fed a diet containing PPS compared to fish fed the FM diet, with fish fed the RSM diet showing significantly higher AST, ALT, ALP, and TG levels and lower TC levels than those fed the FM diet (Table 8). Fish fed the SBM diet, CSM diet, and PNM diet showed similar changes as fish fed the RSM diet in some of these parameters (Table 8).
Table 8: Effects of four types of plant protein sources on the plasma biochemistry of largemouth bass, M. salmoides.
| Diets | FM | SBM | RSM | CSM | PNM |
|---|---|---|---|---|---|
| Aspartate aminotransferase (U/l) | 28.3 ± 2.6d | 51.3 ± 1.5b | 64.7 ± 2.3a | 34.7 ± 4.5c | 66.0 ± 1.7a |
| Alanine aminotransferase (U/l) | 7.3 ± 0.6b | 7.7 ± 0.6b | 13.0 ± 1.0a | 8.7 ± 1.5b | 8.0 ± 1.0b |
| Alkaline phosphatase (U/l) | 113.7 ± 6.7b | 124.0 ± 3.5b | 169.0 ± 1.0a | 113.7 ± 5.0b | 167.3 ± 2.5a |
| Total cholesterol (mmol/l) | 9.7 ± 0.5a | 8.2 ± 0.2bc | 6.7 ± 0.3c | 7.2 ± 1.0bc | 8.6 ± 0.5b |
| Triglyceride (mmol/l) | 7.0 ± 0.2d | 6.8 ± 0.4d | 9.6 ± 0.1a | 7.5 ± 0.4c | 8.6 ± 0.4b |
Note: Values in the same row with different letters are significantly different (P < 0.05, n = 3).
3.5. Organ Index
The VSI and HSI in fish fed the diet containing PPS were lower than those in fish fed the FM diet (P < 0.05, Table 9). The fish fed the SBM diet had the lowest values, followed by those fed the RSM diet. The GBSI was increased in fish fed a diet containing PPS, and that of fish fed the RSM diet and CSM diet were significantly higher than that of fish fed the FM diet (P < 0.05).
Table 9: Effects of four types of plant protein sources on the organ index of largemouth bass, M. salmoides.
| Diets | FM | SBM | RSM | CSM | PNM |
|---|---|---|---|---|---|
| Viscerosomatic index (VSI, %) | 10.89 ± 0.40a | 8.09 ± 0.34d | 8.99 ± 0.19c | 9.48 ± 0.08bc | 10.01 ± 0.50b |
| Hepatosomatic index (HSI, %) | 4.05 ± 0.24a | 2.59 ± 0.32c | 2.72 ± 0.34bc | 2.97 ± 0.33bc | 3.25 ± 0.31b |
| Gallbladder somatic index (GBSI, %) | 0.15 ± 0.01b | 0.17 ± 0.01ab | 0.19 ± 0.03a | 0.19 ± 0.02a | 0.17 ± 0.02ab |
Note: Values in the same row with different letters are significantly different (P < 0.05, n = 3).
3.6. Morphology and Histology of the Liver and Intestine
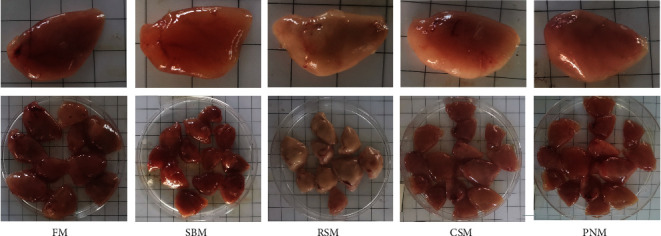
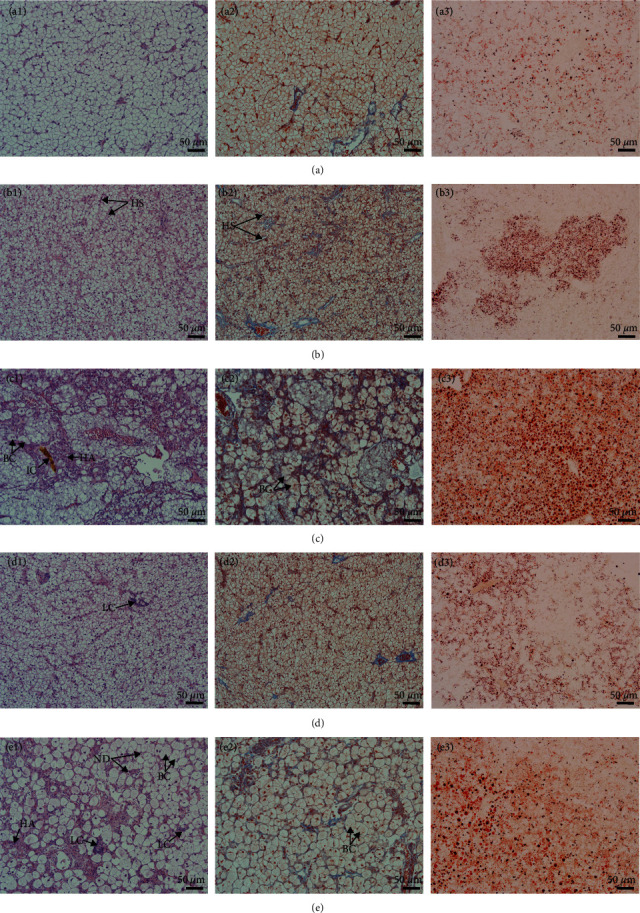
Figure 1 shows the liver morphology of fish fed different experimental diets. In general, the liver size trended toward a decrease in fish fed any of the diets containing PPS compared with fish fed the FM diet. Obvious differences in color were also noticed among the groups, with fish fed the RSM diet showing a white liver phenomenon. From the typical tissue section with H&E staining, the size of hepatocytes in fish fed the FM diet was uniform, and the cell boundary was clear. There was almost no blue collagen signal between hepatocytes on the Masson staining section, and the oil red O staining section showed rare and small lipid droplets (Figure 2(a1)–2(a3)). The fish fed the SBM diet showed hepatic sinusoidal dilatation and capillarization, and the number increased compared with that of the fish fed the FM diet (Figure 2(b1)). Masson-stained sections showed blue collagen signals filling the hepatocyte interstitium (Figure 2(b2)), and oil red O-stained sections showed dense lipid droplets locally (Figure 2(b3)). In fish fed the RSM diet, some hepatocytes were enlarged, and ballooning degeneration was observed. Other hepatocytes were atrophied, and the eosinophilic cytoplasm was enhanced. Diffuse steatosis and necrosis, with cholestasis, were observed (Figure 2(c1)). Masson-stained sections showed that blue collagen signals filled the liver tissue (Figure 2(c2)), and oil red O-stained sections showed that the lipid droplets were large and dense (Figure 2(c3)). In fish fed the CSM diet, local lymphocyte infiltration and a slightly increased density of hepatic sinuses were observed in H&E-stained sections (Figure 2(d1)). Enhanced blue and red signals were observed in Masson- and oil red O-stained sections, respectively (Figures 2(d2) and 2(d3)). In fish fed the PNM diet, a large number of ballooning or atrophied cells were observed in liver sections, and some liver nuclei were decomposed (Figure 2(e1)). Cholestasis could also be observed in slice. Masson-stained sections showed that the collagen signal among hepatocytes was enhanced (Figure 2(e2)), and the size of lipid droplets shown in the oil red O-stained section was enlarged (Figure 2(e3)). In general, the symptoms of liver tissue necrosis in fish fed the PNM diet were similar to those in fish fed the RSM diet, but the degree was slight.
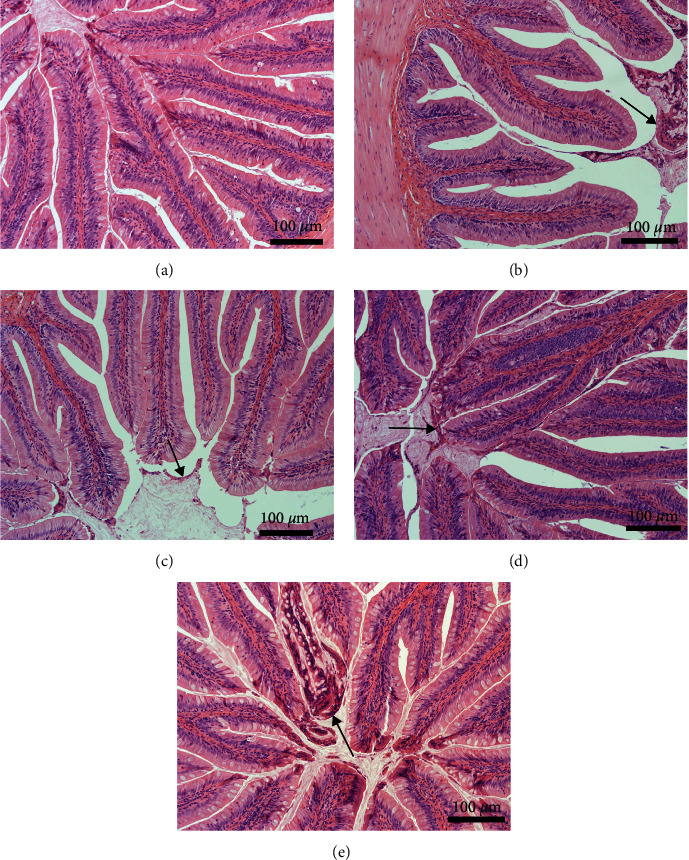
There was no significant difference in the height and width of intestinal folds or the number of goblet cells among the groups (data not provided). The number of exfoliated epithelial cells in the intestinal lumen was higher in fish fed any of the diets containing PPS than in fish fed the FM diet, especially in fish fed the SBM diet and PNM diet (Figure 3).
3.7. Lipid, Collagen, and TBA Contents in the Liver
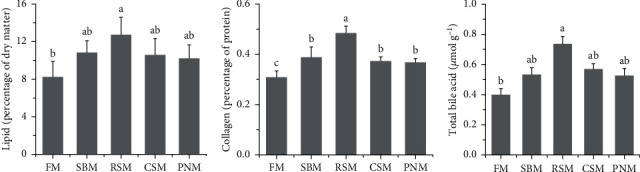
The ranking order of the groups according to lipid and collagen contents in the livers was RSM > SBM > CSM > PNM > FM, and that for the TBA content was RSM > CSM > SBM > PNM > FM (Figure 4). Statistical analysis showed that the lipid and TBA contents in fish fed the RSM diet were markedly higher than those in fish fed the FM diet (P < 0.05), and no significant increase was observed in fish fed the SBM, CSM, and PNM diets (P > 0.05). The collagen content in fish fed the RSM diet was significantly higher than that in fish fed the other diets (P < 0.05), and the collagen content in fish fed the SBM, CSM, and PNM diets was significantly higher than that in fish fed the FM diet (P < 0.05). Both lipid and collagen contents in the liver of fish fed diets containing PPS displayed a high positive correlation with total DF (r = 0.511, P=0.090; r = 0.743, P=0.006) as well as with soluble DF (r = 0.371, P=0.235; r = 0.535, P=0.073).
3.8. Bile Acid Composition
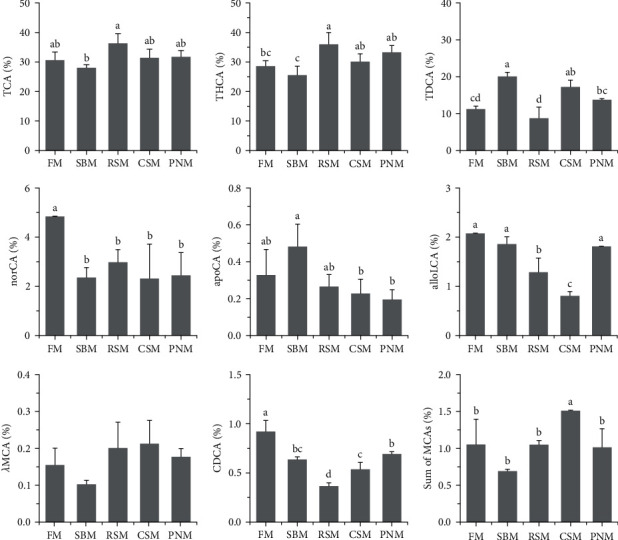
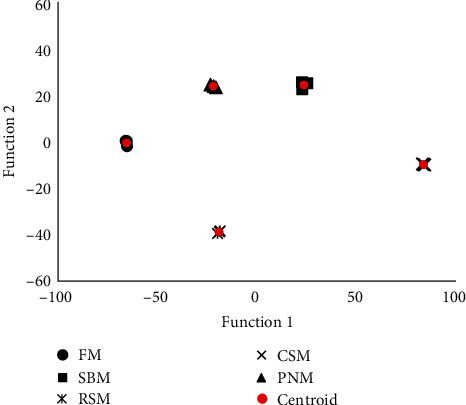
A total of 35 types of bile acid were detected in the liver tissue of largemouth bass (Table 3). The TCA, THCA, TDCA, and NorCA contents accounted for 30.6%, 28.6%, 11.2%, and 4.8% in all detected BAs in fish fed the FM diet (Figure 5). TDCA, apoCA, alloLCA, NorCA, THCA, and λMCA were screened out and entered into the discriminative model. This model could distinguish among the diets very well (Figure 6), with the accuracy of cross-validation reaching 100%. Compared to the fish fed the FM diet, the change trends of individual BAs among fish fed the diet containing PPS were not consistent (Figure 5); however, the percentage of norCA and CDCA in fish fed the diet containing PPS decreased (P < 0.05), and CDCA in fish fed the RSM diet was the lowest (P < 0.05). The percentage of the sum of the MCAs was the highest in fish fed the CSM diet (P < 0.05), and no significant difference was detected among the other groups (P > 0.05, Figure 5).
3.9. Gene Expression
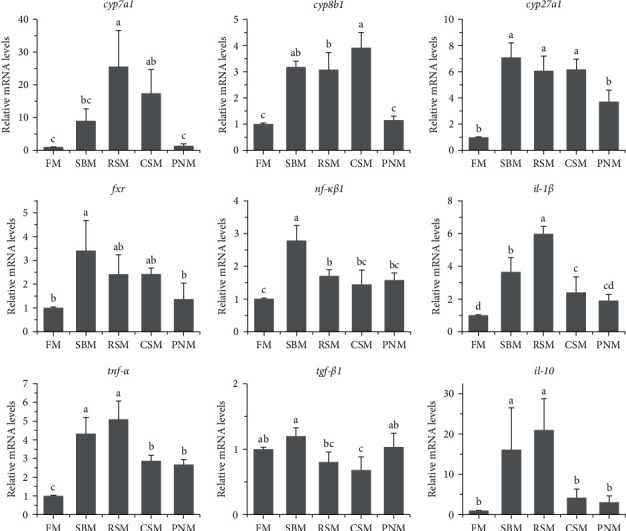
Figure 7 shows the expression of genes related to BA metabolism and inflammatory reactions in the liver. Compared with that of fish fed the FM diet, the expression of cyp7a1 in the liver of fish fed the RSM diet and CSM diet and cyp8b1 and cyp27a1 in fish fed the SBM, RSM, and CSM diets was significantly upregulated (P < 0.05). Additionally, the expression levels of fxr were increased in fish fed any of the diets containing PPS; however, a significant change was detected only in fish fed the SBM diet (P < 0.05). The expression levels of the liver cytokine genes nf-κβ1 and il-10 in fish fed the SBM diet and RSM diet, those of il-1β in fish fed the SBM, RSM, and CSM diets, and those of tnf-α in fish fed the diet containing PPS were significantly increased (P < 0.05). The expression levels of tgf-β1 were decreased in fish fed the RSM diet (P < 0.05).
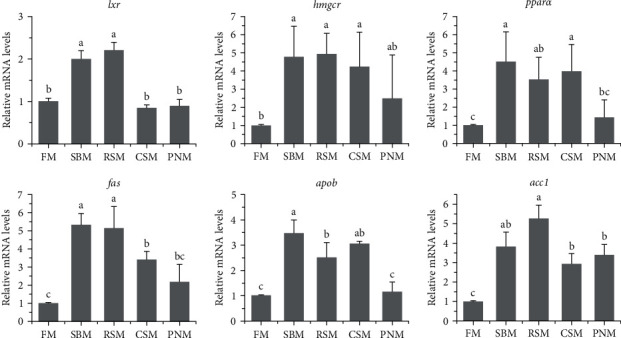
The expression levels of lipid metabolism-related genes, including lxr, hmgcr, pparα, fas, apob, and acc1, in the liver are shown in Figure 8. Statistical analysis showed that the mRNA levels of hmgcr, pparα, fas, apob, and acc1 in the livers of fish fed the SBM, RSM, and CSM diets were significantly higher than those in the livers of fish fed the FM diet (P < 0.05). Most of the above genes in the livers of fish fed the PNM diet were also upregulated; however, only acc1 was significantly different from that of fish fed the FM diet (P < 0.05). The expression levels of lxr in the liver of fish fed the SBM and RSM diets were significantly higher than those in fish fed the other diets (P < 0.05).
4. Discussion
4.1. Growth Performance
To select economical and accessible substitutes for FM, many scholars have carried out comparative studies on the utilization of different PPS [ref. 32–ref. 35]. Decreased SGR was observed in juvenile red claw crayfish, Cherax quadricarinatus, fed a diet with half of the FM (i.e., 24.5% of FM) isonitrogenously replaced by CSM, SBM, RSM, and PNM (PPS was included from 32% to 41%); however, a significant difference was observed only in PNM [ref. 35]. In hybrid tilapia (Oreochromis niloticus × Oreochromis aureus) fed isonitrogenous and isoenergetic diets, the SGR, FER, and PER in fish fed SBM, CSM, and PNM diets, respectively, were higher than those in fish fed the RSM diet (P < 0.05), in which the PPS ranged from 33% to 50% [ref. 36]. Prawns fed the SBM diet and CSM had higher WG and lower FCR than those fed the RSM diet and PNM diet (P < 0.05); the PPS ranged from 16.5% to 22% [ref. 18]. The results of this study showed that the growth performance of fish fed any of the diets containing 25% PPS was significantly lower than that of fish fed the FM diet (P < 0.05); among the four PPS groups, fish fed the RSM diet had the worst growth performance. The results of this study are consistent with previous reports, suggesting that high inclusion of PPS in the diet would reduce fish growth performance and feed utilization.
Among the four diets containing PPS, the RSM diet had the lowest ADCs of dry matter, protein, and lipids, and the PNM diet had the highest ADCs. These findings are in agreement with those of the PER and SGR, suggesting that the low ADC of nutrients is one of the reasons for the poor growth performance of fish fed a diet containing PPS. In addition, the decrease in FI (Table 5) should also contribute to the low SGR of fish fed diets containing PPS.
4.2. Bile Acid
The TBA content in the liver of fish fed any of the diets containing PPS was higher than that of fish fed the FM diet, although a significant difference was observed only in the RSM group (Figure 4). cyp7a1, cyp8b1, and cyp27a1 encode rate-limiting enzymes in the BA synthesis pathway [ref. 37, ref. 38], and the results of this study showed that the expression levels of the above two or all three genes in fish fed SBM, RSM, and CSM diets were significantly upregulated together (P < 0.05, Figure 7). In addition, cholestasis was observed in the liver tissue sections of fish fed the RSM diet (Figure 2(c1)). These results suggest that PPS induced the hypersynthesis of BA. Upregulation of BA synthesis was also observed by previous studies when PPS was included in the fish diets [ref. 27, ref. 39, ref. 40]. However, additional studies have suggested that PPS causes a decrease in BA levels in blood or bile [ref. 41–ref. 43]. The opposite effects may be attributed to the rhythm of BA synthesis. Murashita et al. [ref. 44] reported that the expression levels of BA synthesis genes in the liver of fish fed the SBM-based diets were higher than that of fish fed the FM diet in a short-term feeding trial (<24 hr), while in the long-term feeding trial (10 weeks), they had significantly lower expression levels.
In addition to the TBA content, the BA profiles in the liver also varied significantly among groups, and six types of BA, i.e., TDCA, apoCA, alloLCA, NorCA, THCA, and λMCA could be used to distinguish diets very well, with the discriminatory accuracy reaching 100% (Figure 6). These findings suggest that the BA profile was sensitive to PPS. All the BAs that were screened into the discriminative model were secondary BAs, which are produced by intestinal microflora. It was therefore speculated that a great differentiation in the structure and/or function of intestinal microflora was induced by different PPS, which has often been observed [ref. 40, ref. 45].
4.3. Histology of the Liver and Gut
There was a decreasing trend in the size of the liver of fish fed any of the diets containing PPS (Figure 1), and the HSI was significantly lower than that of fish fed the FM diet (P < 0.05, Table 9). Decreased HSI has been reported in tiger puffer, Takifugu rubripes [ref. 46], redlip mullet, Liza hematocheila [ref. 1], and largemouth bass [ref. 47] when the diet contained high level of PPS. The reason may lie in the high level of TBA in the liver. BA has cytotoxicity and can directly induce tissue necrosis [ref. 48, ref. 49], which was observed in liver sections of fish fed the RSM (Figure 2) diet and PNM diet in this study. BA can also cause oxidative stress and mitochondrial dysfunction and then lead to the production of proinflammatory cytokines [ref. 50–ref. 52]. Proinflammatory cytokines further cause liver cell apoptosis [ref. 52, ref. 53]. Nuclear factor (NF-κβ1), tumor necrosis factor-α (TNF-α), and interleukin-1β (IL-1β) are typical proinflammatory cytokines, and the expression of tnf-α, il-1β, and nf-κβ1 in fish fed a diet containing PPS was upregulated (Figure 7). It was therefore speculated that the tissue necrosis, inflammatory reaction, and cell apoptosis induced by high concentrations of TBA may be important reasons for the decrease in liver size and HSI in fish fed diets containing PPS. AST and ALT are released into the blood when the liver tissue is injured, which should be the reason for the increased plasma AST and ALT activity in fish fed a diet containing PPS (Table 8).
This study and existing reports [ref. 1, ref. 46, ref. 47, ref. 54, ref. 55] showed that replacing FM with PPS would cause a decrease in HSI; however, there were also studies showing liver enlargement or increases in HSI in such conditions [ref. 2, ref. 56, ref. 57]. In this study, the liver tissue sections of fish fed the RSM and PNM diets clearly showed that some hepatocytes were swollen and ballooned, while others were atrophic and necrotic. It was therefore speculated that HSI decreases when hepatocytes generally decrease or become necrotic. However, when most of the cells in the liver are swollen or ballooned, the liver may be enlarged, and the HSI may increase.
White liver generally indicates steatosis [ref. 58, ref. 59], and apob is highly expressed in fatty liver [ref. 60]. In this study, the mRNA level of apob was higher in fish fed the diet containing PPS than in those fed the FM diet (Figure 8). The color (Figure 1) and histology of the liver (Figure 2) and the liver lipid content (Figure 4) all suggested that hepatic steatosis occurred in fish fed the diet containing PPS, with the most serious steatosis in fish fed the RSM diet. acc1 and fas encode acetyl-CoA carboxylase 1 and fatty acid synthesis, respectively, which are the key enzymes catalyzing the de novo synthesis of fatty acids [ref. 61]. FAS synthetic products can be used as endogenous activators of PPARα [ref. 62], which participates in the regulation of lipid production [ref. 62] and homeostasis [ref. 63]. In this study, the expression levels of acc1 in fish fed any of the diets containing PPS were higher than those in fish fed FM (P < 0.05), and the expression levels of pparα and fas in fish fed the SBM, RSM, and CSM diets was also higher than those in fish fed the FM diet (P < 0.05). These findings indicate that the de novo synthesis of lipids in the livers of fish fed diets containing PPS was enhanced and that the homeostasis of fat metabolism was disrupted. These might be the reasons for the increase in liver lipid content. Medical studies have also shown that hepatic steatosis is often accompanied by increased de novo synthesis of fatty acids [ref. 64, ref. 65].
All factors causing chronic injury of liver tissue can activate a variety of cells and pathways and then cause a repair reaction. This repair reaction will cause the deposition of extracellular matrix (ECM, which is a fibrosis component) and then cause liver fibrosis [ref. 51]. At higher than physiological concentrations, BA is an important cause of chronic tissue damage, which can also lead to liver fibrosis [ref. 48]. In addition, upregulated expression of tnf-α, il-1β, and nf-κβ1 aggravates fibrosis [ref. 50]. All these reasons contributed to the hepatic fibrosis observed in fish fed any of the diets containing PPS. According to the collagen content in the liver, the liver injury and repair reactions in fish fed the RSM diet were the strongest.
Studies have shown that noninfective enteritis could be induced by SBM in salmon, which was mainly manifested by the widening of the submucosa and lamina propria and lymphocyte infiltration [ref. 3, ref. 66]. Enteritis induced by SBM can be repaired after fasting for 2 days [ref. 66]. In this study, no symptoms mentioned above were noticed, and only more exfoliated epithelial cells were observed in the intestinal lumen of fish fed a diet containing PPS than in that of fish fed an FM diet, which might indicate an enhanced capacity for repairing the intestine.
4.4. Potential Pathogenic Mechanisms
The results of this study indicated that the agent caused a decrease in ADCs and liver damage existed in all four selected PPSs, and DF was suspected. It is well-known that DF in the diet decreases the nutrient ADC [ref. 67]. More importantly, DF can bind BA [ref. 27, ref. 68, ref. 69], and BAs are also signaling molecules [ref. 70] and endogenous ligands for farnesoid X receptor (FXR) [ref. 71], which negatively regulate BA synthesis [ref. 71]. In other words, when part of the BAs in the intestine is trapped by DF, FXR activity is inhibited, resulting in excessive synthesis of BAs [ref. 14–ref. 16, ref. 72]. This explains the increased TBA content in the liver and the change in BA profiles. CDCA functions as the most effective FXR agonist, while disruption of FXR results in generalized inflammation [ref. 73]. The results of this study showed that the CDCA content in the liver of fish fed a diet containing any type of PPS was lower than that of fish fed the FM diet, with the fish fed the RSM diet being the lowest (P < 0.05, Figure 5). These results were in agreement with the degree of liver injury. Insufficient FXR activity may further enhance the expression of fxr, as observed in this study (Figure 7). In addition, the liver lipid and collagen contents were significantly correlated with DF as well as SDF in the diet. All these results support that DF might be an important pathogenic agent in PPS.
α/βMCAs and their glycine and taurine derivatives are FXR antagonists in mice [ref. 73]. In this study, however, no significant increase in the sum of MCAs was observed in fish fed the RSM diet, whose liver was seriously damaged, suggesting that liver injury could not be explained by the regulatory effect of MCA on FXR. BA-activated receptors include FXR, TGR5, SIPR, etc., and various BAs have different or even opposite activation effects on different receptors, balancing each other to maintain immune and metabolic homeostasis [ref. 73]. Therefore, the impact of DF contained in PPSs on BA homeostasis and the resulting physiological reactions in fish are worth further study.
Cholesterol is the precursors for the synthesis of BAs, and LXRα participates in regulating cholesterol efflux and maintaining the homeostasis of intracellular cholesterol [ref. 74]. HMG-CoA reductase (HMGCR) is the key enzyme for cholesterol synthesis [ref. 75]. The results of this study showed that the expression levels of hmgcr in the liver of fish fed the SBM diet, RSM diet, and CSM diet were higher than those fed the FM diet (P < 0.05), and the expression levels of lxr in fish fed the SBM and RSM diet were also significantly higher than those fed the FM diet (P < 0.05). These findings suggest that cholesterol synthesis and efflux were enhanced, which may be to meet the need of the hypersynthesis of BA. However, the plasma TC content of fish fed a diet containing PPS was lower than that of fish fed an FM diet, suggesting that the hypersynthesis of cholesterol was insufficient to compensate for the consumption in BA synthesis. Hypocholesterolemia is one of the important effects of DF [ref. 67, ref. 72].
When the level of PPS in diet is low in the diet, DF might mainly exert positive effects, such as improving the health of the liver and intestine [ref. 76]. Under this condition, the imbalance of amino acids may be an important factor that limits PPS utilization. The amino acid balance of SBM is better than that of CSM, PNM, and RSM [ref. 77]; therefore, SBM showed better growth performance than the other PPS [ref. 18]. However, when the inclusion level of PPS was high, the antinutritional effect of DF was highlighted, especially when cholesterol was in shortage [ref. 39]. The effect of DFs on BA homeostasis is related not only to their content and viscosity but also to their fermentability [ref. 13, ref. 69]. Fermentable DF could affect the composition of intestinal microorganisms as well as their metabolites, thus producing a stronger physiological impact than nonfermentable DF [ref. 14, ref. 69]. The DF in soybean has strong fermentability, which can be demonstrated from traditional fermented soybean foods, such as soy sauce, soybean paste, lobster sauce, and sufu. When the supplementation level of SBM was high in the diet, the advantage in amino acid balance might be masked by the antinutritional effect of DF. This might be attributed to the lowest HSI in fish fed the SBM diet and the lack of advantages compared to CSM in fish growth (Table 5) [ref. 35, ref. 36].
5. Conclusion
The inclusion of 25% of each SBM, RSM, CSM, and PNM in the diet exceeded the tolerance range of largemouth bass and caused liver damage, which might be mediated by BA. DF in PPS might be an important agent contributing to liver damage.
References
- T. Liu, T. Han, J. Wang. Effects of replacing fish meal with soybean meal on growth performance, feed utilization and physiological status of juvenile redlip mullet Liza haematocheila. Aquaculture Reports, 2021. [DOI]
- Y. Zhang, P. Chen, X. F. Liang. Metabolic disorder induces fatty liver in Japanese seabass, Lateolabrax japonicas fed a full plant protein diet and regulated by cAMP-JNK/NF-kB-caspase signal pathway. Fish & Shellfish Immunology, 2019. [DOI | PubMed]
- I. S. Marjara, E. M. Chikwati, E. C. Valen, A. Krogdahl, A. M. Bakke. Transcriptional regulation of IL-17A and other inflammatory markers during the development of soybean meal-induced enteropathy in the distal intestine of Atlantic salmon (Salmo salar L.). Cytokine, 2012. [DOI | PubMed]
- C. Sahlmann, J. Gu, T. M. Kortner, I. Lein, A. Krogdahl, A. M. Bakke. Ontogeny of the digestive system of Atlantic salmon (Salmo salar L.) and effects of soybean meal from start-feeding. PLoS One, 2015. [DOI]
- X. Li, S. Zheng, X. Ma, K. Cheng, G. Wu. Use of alternative protein sources for fishmeal replacement in the diet of largemouth bass (Micropterus salmoides). Part I: effects of poultry by-product meal and soybean meal on growth, feed utilization, and health. Amino Acids, 2021. [DOI | PubMed]
- Y. L. Liu, Q. S. Lu, L. W. Xi. Effects of replacement of dietary fishmeal by cottonseed protein concentrate on growth performance, liver health, and intestinal histology of largemouth bass (Micropterus salmoides). Frontiers in Physiology, 2021. [DOI]
- J. F. Howlett, V. A. Betteridge, M. Champ, S. A. Craig, A. Meheust, J. M. Jones. The definition of dietary fiber—discussions at the ninth vahouny fiber symposium: building scientific agreement. Food & Nutrition Research, 2010
- D. Mudgil, S. Barak. Composition, properties and health benefits of indigestible carbohydrate polymers as dietary fiber: a review. International Journal of Biological Macromolecules, 2013. [DOI | PubMed]
- S. Zhang, J. Zhao, F. Xie. Dietary fiber-derived short-chain fatty acids: a potential therapeutic target to alleviate obesity-related nonalcoholic fatty liver disease. Obesity Reviews, 2021. [DOI]
- Q. Ali, S. Ma, S. La. Microbial short-chain fatty acids: a bridge between dietary fibers and poultry gut health—a review. Animal Bioscience, 2022. [DOI | PubMed]
- D. A. Kieffer, R. J. Martin, S. H. Adams. Impact of dietary fibers on nutrient management and detoxification organs: gut, liver, and kidneys. Advances in Nutrition, 2016. [DOI | PubMed]
- Y.-F. Zhong, C.-M. Shi, Y.-l. Zhou, Y.-J. Chen, S.-M. Lin, R.-J. Tang. Optimum dietary fiber level could improve growth, plasma biochemical indexes and liver function of largemouth bass, Micropterus salmoides. Aquaculture, 2020
- V. Singh, M. Vijay-Kumar. Beneficial and detrimental effects of processed dietary fibers on intestinal and liver health: health benefits of refined dietary fibers need to be redefined!. Gastroenterology Report, 2020. [DOI | PubMed]
- V. Singh, B. S. Yeoh, B. Chassaing. Dysregulated microbial fermentation of soluble fiber induces cholestatic liver cancer. Cell, 2018. [DOI | PubMed]
- C. Cai, S. Ren, G. Cui. Short-term stress due to dietary pectin induces cholestasis, and chronic stress induces hepatic steatosis and fibrosis in yellow catfish, Pelteobagrus fulvidraco. Aquaculture, 2020
- S. Ren, C. Cai, G. Cui. High dosages of pectin and cellulose cause different degrees of damage to the livers and intestines of Pelteobagrus fulvidraco. Aquaculture, 2020
- K. Ghosh, A. K. Ray, E. Ringø. Applications of plant ingredients for tropical and subtropical freshwater finfish: possibilities and challenges. Reviews in Aquaculture, 2019
- Y.-J. Huang, N.-N. Zhang, W.-J. Fan. Soybean and cottonseed meals are good candidates for fishmeal replacement in the diet of juvenile Macrobrachium nipponense. Aquaculture International, 2017
- J. Z. Miao, Z. Q. Lv, Z. H. Cao, Y. W. Dong. Study on enzyme extraction of dietary fiber from soybean meal. China Food Additives, 2009
- L. B. Li, Y. Sun, J. J. Ding, Z. L. Na, C. X. Nie. Comparative study of dietary fiber content, physical and chemical properties, structure and in vitro fermentation characteristics of different cake meal feeds. Feed Research, 2023
- D. I. Adewole, A. Rogiewicz, B. Dyck, B. A. Slominski. Chemical and nutritive characteristics of canola meal from Canadian processing facilities. Animal Feed Science and Technology, 2016
- J. Qin, J. Z. Miao, Y. W. Dong. extraction of total dietary fiber in peanut meal by two enzyme method. Food Science and Technology, 2011
- L. Weng, Z. Wang, W. Zhuang. Effect of replacing fish meal using fermented soybean meal on growth performance, intestine bacterial diversity, and key gene expression of largemouth bass (Micropterus salmoides). Fermentation, 2023
- P. Yin, S. Xie, Y. Huo. Effects of dietary oxidized fish oil on growth performance, antioxidant defense system, apoptosis and mitochondrial function of juvenile largemouth bass (Micropterus salmoides). Aquaculture, 2019
- L. L. Yu, H. H. Yu, X. F. Liang. Dietary butylated hydroxytoluene improves lipid metabolism, antioxidant and anti-apoptotic response of largemouth bass (Micropterus salmoides). Fish & Shellfish Immunology, 2018. [DOI | PubMed]
- S. Xie, P. Yin, L. Tian, Y. Liu, J. Niu. Lipid metabolism and plasma metabolomics of juvenile largemouth bass Micropterus salmoides were affected by dietary oxidized fish oil. Aquaculture, 2020
- Q. Ni, C. Cai, S. Ren. Pectin and soybean meal induce stronger inflammatory responses and dysregulation of bile acid (BA) homeostasis than cellulose and cottonseed meal, respectively, in largemouth bass (Micropterus salmoides), which might be attributed to their BA binding capacity. Aquaculture Research, 2021. [DOI]
- S-M. Lin, X-M. Zhou, Y-L. Zhou. Intestinal morphology, immunity and microbiota response to dietary fibers in largemouth bass, Micropterus salmoide. Fish & Shellfish Immunology, 2020. [DOI | PubMed]
- P. Yin, S. Xie, Z. Zhuang. Dietary supplementation of bile acid attenuate adverse effects of high-fat diet on growth performance, antioxidant ability, lipid accumulation and intestinal health in juvenile largemouth bass (Micropterus salmoides). Aquaculture, 2021
- Y. Chen, Z. Sun, Z. Liang. Addition of l-carnitine to formulated feed improved growth performance, antioxidant status and lipid metabolism of juvenile largemouth bass, Micropterus salmoides. Aquaculture, 2020
- Y. Huang, S. Wang, X. Meng, N. Chen, S. Li. Molecular cloning and characterization of sirtuin 1 and its potential regulation of lipid metabolism and antioxidant response in largemouth bass (Micropterus salmoides). Frontiers in Physiology, 2021
- C. Cai, L. Song, Y. Wang. Assessment of the feasibility of including high levels of rapeseed meal and peanut meal in diets of juvenile crucian carp (Carassius auratus gibelio♀ × Cyprinus carpio♂): growth, immunity, intestinal morphology, and microflora. Aquaculture, 2013. [DOI]
- A. J. Mo, J. X. Sun, Y. H. Wang, K. Yang, H. S. Yang, Y. C. Yuan. Apparent digestibility of protein, energy and amino acids in nine protein sources at two content levels for mandarin fish, Siniperca chuatsi. Aquaculture, 2019. [DOI]
- J. Che, B. Su, B. Tang. Apparent digestibility coefficients of animal and plant feed ingredients for juvenile Pseudobagrus ussuriensis. Aquaculture Nutrition, 2017. [DOI]
- D. Qian, X. Yang, C. Xu. Growth and health status of the red claw crayfish, cherax quadricarinatus, fed diets with four typical plant protein sources as a replacement for fish meal. Aquaculture Nutrition, 2021. [DOI]
- S. Lin, K. Mai, B. Tan, W. Liu. Effects of four vegetable protein supplementation on growth, digestive enzyme activities, and liver functions of juvenile tilapia, Oreochromis niloticus × Oreochromis aureus. Journal of the World Aquaculture Society, 2010
- J. Y. Chiang, W. Chen, M. Zheng, Z. Wu, R. Kimmel, D. Stroup. Bile acids and FXR represses cholesterol 7A-hydroxylase (CYP7A1), sterol 12A-hydroxylase (CYP8B1) and sterol 27-hydroxylase (CYP27A1), but not oxysterol 7A-hydroxylase (CYP7B1) gene transcription. Gastroenterology, 2000
- Y. Kong, M. Li, X. Wu, C. Xia, X. Liu, G. Wang. Protective mechanism of homologous lactic acid bacteria against cholestatic liver injury in snakehead fish. Aquaculture, 2022
- T. M. Kortner, J. Gu, A. Krogdahl, A. M. Bakke. Transcriptional regulation of cholesterol and bile acid metabolism after dietary soyabean meal treatment in Atlantic salmon (Salmo salar L.). The British Journal of Nutrition, 2013. [DOI | PubMed]
- H. C. Wei, S. J. Xing, P. Chen. Plant protein diet-induced hypoimmunity by affecting the spiral valve intestinal microbiota and bile acid enterohepatic circulation in amur sturgeon (Acipenser schrenckii). Fish & Shellfish Immunology, 2020. [DOI | PubMed]
- T. Yamamoto, Y. Iwashita, H. Matsunari. Influence of fermentation conditions for soybean meal in a non-fish meal diet on the growth performance and physiological condition of rainbow trout Oncorhynchus mykiss. Aquaculture, 2010
- H. P. Nguyen, T. V. Do. Digested soybean protein and taurine influence bile acid level, lipase activity, lipid digestibility, and growth performance of pompano (Trachinotus blochii). Fish Physiology and Biochemistry, 2021. [DOI | PubMed]
- F. Takakuwa, K. Murashita, Y. Noguchi. Effects of long-term feeding of fishmeal-free diet on growth parameters, bile acid status, and bile acid-related gene expression of yearling red sea bream Pagrus major (Temminck and Schlegel, 1843). Aquaculture, 2023. [DOI]
- K. Murashita, I. Rønnestad, H. Furuita, H. Matsunari, H. Oku, T. Yamamoto. Effects of dietary soybean meal on the bile physiology in rainbow trout, Oncorhynchus mykiss. Aquaculture, 2018
- Z. Zhang, L. Xi, H. Liu. High replacement of fishmeal by Chlorella meal affects intestinal microbiota and the potential metabolic function in largemouth bass (Micropterus salmoides). Frontiers in Microbiology, 2022. [DOI]
- S.-J. Lim, S.-S. Kim, G.-Y. Ko. Fish meal replacement by soybean meal in diets for tiger puffer, Takifugu rubripes. Aquaculture, 2011
- X. Li, S. Zheng, K. Cheng, X. Ma, G. Wu. Use of alternative protein sources for fishmeal replacement in the diet of largemouth bass (Micropterus salmoides). Part II: effects of supplementation with methionine or taurine on growth, feed utilization, and health. Amino Acids, 2021. [PubMed]
- B. L. Woolbright, H. Jaeschke. Inflammation and cell death during cholestasis: the evolving role of bile acids. Gene Expression, 2019. [DOI | PubMed]
- G. Xu, L. X. Pan, H. Li. Regulation of the farnesoid X receptor (FXR) by bile acid flux in rabbits. Journal of Biological Chemistry, 2002. [DOI | PubMed]
- A. Ahmadi, H. Niknahad, H. Li. The inhibition of NFкB signaling and inflammatory response as a strategy for blunting bile acid-induced hepatic and renal toxicity. Toxicology Letters, 2021. [DOI]
- R. Bataller, D. A. Brenner. Liver fibrosis. Journal of Clinical Investigation, 2005. [DOI | PubMed]
- E. Rauchbach, H. Zeigerman, D. Abu-Halaka, O. Tirosh. Cholesterol induces oxidative stress, mitochondrial damage and death in hepatic stellate cells to mitigate liver fibrosis in mice model of NASH. Antioxidants, 2022. [DOI]
- A. Wullaert, B. Wielockx, S. V. Huffel. Adenoviral gene transfer of ABIN-1 protects mice from TNF/galactosamine-induced acute liver failure and lethality. Hepatology, 2005. [DOI | PubMed]
- M. Gu, N. Bai, T. M. Kortner. Taurocholate supplementation attenuates the changes in growth performance, feed utilization, lipid digestion, liver abnormality and sterol metabolism in turbot (Scophthalmus maximus) fed high level of plant protein. Aquaculture, 2017
- A.-C. Hansen, G. Rosenlund, Ø. Karlsen, W. Koppe, G.-I. Hemre. Total replacement of fish meal with plant proteins in diets for Atlantic cod (Gadus morhua L.) I—effects on growth and protein retention. Aquaculture, 2007
- H. Ye, M. Xu, L. Chen. Effects of dietary plant protein sources influencing hepatic lipid metabolism and hepatocyte apoptosis in hybrid grouper (Epinephelus lanceolatus♂ × Epinephelus fuscoguttatus♀). Aquaculture, 2019
- A. J. Hernández, D. Román, J. Hooft, C. Cofre, V. Cepeda, R. Vidal. Growth performance and expression of immune-regulatory genes in rainbow trout (Oncorhynchus mykiss) juveniles fed extruded diets with varying levels of lupin (Lupinus albus), peas (Pisum sativum) and rapeseed (Brassica napus). Aquaculture Nutrition, 2013. [DOI]
- C. Mu, N. Nikpoor, T. A. Tompkins, J. M. Rho, M. H. Scantlebury, J. Shearer. Probiotics counteract hepatic steatosis caused by ketogenic diet and upregulate AMPK signaling in a model of infantile epilepsy. EBioMedicine, 2022. [DOI]
- E. H. Johnson, D. E. Muirhead, K. Annamalai, G. J. King, R. Al-Busaidy, M. S. Hameed. Hepatic lipidosis associated with cobalt deficiency in omani goats. Veterinary Research Communications, 1999. [DOI | PubMed]
- N. Higuchi, M. Kato, M. Tanaka. Effects of insulin resistance and hepatic lipid accumulation on hepatic mRNA expression levels of apoB, MTP and L-FABP in non-alcoholic fatty liver disease. Experimental and Therapeutic Medicine, 2011. [DOI | PubMed]
- S. Li, C.-W. Lu, E. C. Diem. Acetyl-CoA-Carboxylase 1-mediated de novo fatty acid synthesis sustains Lgr5(+) intestinal stem cell function. Nature Communications, 2022. [DOI]
- M. V. Chakravarthy, Z. Pan, Y. Zhu. “New” hepatic fat activates PPARα to maintain glucose, lipid, and cholesterol homeostasis. Cell Metabolism, 2005. [DOI | PubMed]
- D. Cai, Y. Li, K. Zhang. Co-option of PPARα in the regulation of lipogenesis and fatty acid oxidation in CLA-induced hepatic steatosis. Journal of Cellular Physiology, 2021. [DOI | PubMed]
- C. Postic, J. Girard. Contribution of de novo fatty acid synthesis to hepatic steatosis and insulin resistance: lessons from genetically engineered mice. The Journal of Clinical Investigation, 2008. [DOI | PubMed]
- G. E. I. I. I. Howell, E. McDevitt, L. Henein, C. Mulligan, D. Young. Trans-nonachlor increases extracellular free fatty acid accumulation and de novo lipogenesis to produce hepatic steatosis in McArdle-RH7777 cells. Toxicol in Vitro, 2018. [DOI | PubMed]
- G. Baeverfjord, A. Krogdahl. Development and regression of soybean meal induced enteritis in Atlantic salmon, Salmo salar L., distal intestine: a comparison with the intestines of fasted fish. Journal of Fish Diseases, 1996
- Y. Liu, Y. Zhang, J. Fan. Effects of different viscous guar gums on growth, apparent nutrient digestibility, intestinal development and morphology in juvenile largemouth bass, Micropterus salmoides. Frontiers in Physiology, 2022. [DOI]
- I. M. V. Silva, F. Machado, M. J. Moreno, C. Nunes, M. A. Coimbra, F. Coreta-Gomes. Polysaccharide structures and their hypocholesterolemic potential. Molecules, 2021
- J. Singh, R. Metrani, S. R. Shivanagoudra, G. K. Jayaprakasha, B. S. Patil. Review on bile scids: effects of the gut microbiome, interactions with dietary fiber, and alterations in the bioaccessibility of bioactive compounds. Journal of Agricultural and Food Chemistry, 2019. [DOI | PubMed]
- S. Fiorucci, E. Distrutti, A. Carino, A. Zampella, M. Biagioli. Bile acids and their receptors in metabolic disorders. Progress in Lipid Research, 2021. [DOI]
- W.-D. Chen, Y.-D. Wang, Z. Meng, L. Zhang, W. Huang. Nuclear bile acid receptor FXR in the hepatic regeneration. Biochimica et Biophysica Acta (BBA)—Molecular Basis of Disease, 2011. [DOI | PubMed]
- S. Moriceau, C. Besson, M. A. Levrat. Cholesterol-lowering effects of guar gum: changes in bile acid pools and intestinal reabsorption. Lipids, 2000. [DOI | PubMed]
- S. Fiorucci, A. Zampella, P. Ricci, E. Distrutti, M. Biagioli. Immunomodulatory functions of FXR. Molecular and Cellular Endocrinology, 2022. [DOI]
- C. Zhao, K. Dahlman-Wright. Liver X receptor in cholesterol metabolism. Journal of Endocrinology, 2010. [DOI | PubMed]
- X-Y. Lu, X-J. Shi, A. Hu. Feeding induces cholesterol biosynthesis via the mTORC1-USP20-HMGCR axis. Nature, 2020. [DOI | PubMed]
- L. M. Fu, G. B. Zhang, S. S. Qian, Q. Zhang, M. M. Tan. Associations between dietary fiber intake and cardiovascular risk factors: an umbrella review of meta-analyses of randomized controlled trials. Frontiers in Nutrition, 2022
- C.-X. Zhang, K.-K. Huang, L. Wang, K. Song, L. Zhang, P. Li. Apparent digestibility coefficients and amino acid availability of common protein ingredients in the diets of bullfrog, Rana (Lithobates) catesbeiana. Aquaculture, 2015