Measuring intratumor heterogeneity by network entropy using RNA-seq data
Abstract
Intratumor heterogeneity (ITH) is observed at different stages of tumor progression, metastasis and reouccurence, which can be important for clinical applications. We used RNA-sequencing data from tumor samples, and measured the level of ITH in terms of biological network states. To model complex relationships among genes, we used a protein interaction network to consider gene-gene dependency. ITH was measured by using an entropy-based distance metric between two networks, nJSD, with Jensen-Shannon Divergence (JSD). With nJSD, we defined transcriptome-based ITH (tITH). The effectiveness of tITH was extensively tested for the issues related with ITH using real biological data sets. Human cancer cell line data and single-cell sequencing data were investigated to verify our approach. Then, we analyzed TCGA pan-cancer 6,320 patients. Our result was in agreement with widely used genome-based ITH inference methods, while showed better performance at survival analysis. Analysis of mouse clonal evolution data further confirmed that our transcriptome-based ITH was consistent with genetic heterogeneity at different clonal evolution stages. Additionally, we found that cell cycle related pathways have significant contribution to increasing heterogeneity on the network during clonal evolution. We believe that the proposed transcriptome-based ITH is useful to characterize heterogeneity of a tumor sample at RNA level.
Affiliations: Interdisciplinary Program in Bioinformatics, Seoul National University, Seoul, 151-742, Korea; Department of Life Science, College of Natural Sciences, Hanyang University, Seoul, 133-791, Korea; Research Institute for Natural Sciences, Hanyang University, Seoul, 133-791, Korea; Department of Computer Science and Engineering, Seoul National University, Seoul, 151-742, Korea; Bioinformatics Institute, Seoul National University, Seoul, 151-742, Korea
License: Copyright © 2016, The Author(s) CC BY 4.0 This work is licensed under a Creative Commons Attribution 4.0 International License. The images or other third party material in this article are included in the article’s Creative Commons license, unless indicated otherwise in the credit line; if the material is not included under the Creative Commons license, users will need to obtain permission from the license holder to reproduce the material. To view a copy of this license, visit http://creativecommons.org/licenses/by/4.0/
Article links: DOI: 10.1038/srep37767 | PubMed: 27883053 | PMC: PMC5121893
Relevance: Moderate: mentioned 3+ times in text
Full text: PDF (1.8 MB)
Cancer has a complex system consisting of different cancer clones that interact with each other and also with normal cells, known as intratumor heterogienty (ITH)ref. 1. The complexity from ITH is a major hurdle to understanding of the dynamics of cancer systems and also difficult to predict therapeutic outcomesref. 2. Intratumor heterogeneity is the consequence of clonal evolution of a single tumorref. 3. One of the main cause of this ITH is genomic instability of cancer cellsref. 4. High-throughput sequencing technology is widely used to measure ITH at molecular level. A recent study revealed that diverse clones with different genomic signatures co-exist in a single tumorref. 5. Diversity of clones give evolutional advantage in metastasisref. 6. Additionally, diverse subclones are known to be under high pressure of natural selection in therapeutic circumstance and even cause therapeutic resistanceref. 7ref. 8. This clonal evolution during chemotherapy makes current target-drug therapy difficultref. 2ref. 9ref. 10. However, there still remains an evolutionary issue about selective process during neoplasia, i.e., which daughter cells are selected and survive. To this issue, a colon cancer study suggested a big bang model without selective sweeps and a liver cancer study proposed non-darwinian evolution in tumorref. 11ref. 12. Whether or not selective force being present, overproduction of subclones highly-likely results in ITH.
Molecular level ITH has been identified with multiregional sequencingref. 11ref. 13. Although this multiregional sequencing is at the forefront of ITH studies, single-cell genomics has emerged as the most credible technologyref. 14. Single-cell sequencing has an advantage on direct sequencing of each cloneref. 15. However, experimental cost of single-cell sequencing is too high for clinical applications. Thus, researchers have developed computational methods to infer ITH with bulk-tumor sequencing data as an aggregated metadata of each clone’s genomic information. In general, daughter cells carry exactly the same parental genomic information. However, their DNA replication system malfunctions, often in cancer, and leaves de novo mutational signatures, furthermore copy number alterations (CNA) and loss of heterozygosity (LOH)ref. 16ref. 17. Those genomic alterations remain from generation to generation, thus enabling the backtracing genomic signaturesref. 13ref. 18. On the same principle, inferring subclones from the genomic landscape of bulk tumor sequencing is a widely used strategyref. 19ref. 20ref. 21. Computational methods, such as PyClone and EXPANDS, are current state-of-the-art tools that use mutational information to infer subclonal populationsref. 22ref. 23. Clinical relevance of inferred ITH was also highlighted in related to prognostic outcomesref. 24ref. 25.
Although the ITH inference based on genomic information were successful, there remain a few more issues that need further investigation. For example, a study reported that patients with a moderate number of subclones (3 or 4 clones) implicates a higher risk than more heterogeneous patients (above 4 clones)ref. 24. They discussed that there is a trade-off between the advantage of diversity and the cost of generating inviable daughter cells, however as mentioned earlier the selective sweep during cancer progression is still in questions. To understand better in tumor heterogeneity and clonal evolutionary process, we need to investigate three issues when genomic information is used for ITH prediction. First, it is a difficult to define whether a somatic mutation as either a driver or a passenger mutation in terms of cancer genome evolutionref. 26. The study about neutral evolution of tumor proposed that driver mutation can be altered differently in a certain contextref. 27. As a result, inference of ITH with driver gene mutations may not reflect true subclonal population. Second, the mutational information alone is insufficient to identify cellular activities of subclones in cancer. Furthermore, cell plasticity needs to be considered in ITH since phenotypes of cancer subclones can be altered without inheritable genomic variationsref. 28. A colon cancer study revealed that different phenotypes can exist with no differences in genotypesref. 29. Lastly, cancer microenvironment is important in clonal evolution, tumor progression and metastasisref. 1ref. 30ref. 31. According to current researches, different clonal activities and surrounding stromal and immune cells effects on cancer progressionref. 32ref. 33. This finding was also confirmed in a single-cell sequencing studyref. 34. However, mutational lineage analysis could only detect heterogeneity of cancer clones, not other effects from microenvironmental factors. Therefore, we believe that, in addition to the current DNA-based ITH inference, measuring ITH at the RNA level can provide a new insight on ITH and its clinical applications.
To investigate the functional differences of heterogeneous clones, we developed a method for ITH inference using RNA-sequencing data. There are two major reasons why RNA-sequencing data was used. First, RNA- sequencing data is ubiquitous as much as genomic data. Second, like mutations, transcriptome is also used in evolutionary studiesref. 35ref. 36. However, there is a challenge for analysis at the RNA level. Complex gene-gene dependency needs to be consideredref. 37. Thus, we used a biological network which is the most effective tool for modeling the complex gene-gene relationship – protein interaction network (PIN) and pathway informationref. 38ref. 39ref. 40.
Given a network, an effective metric is needed to quantify differences in the network perturbation to reflect both expression levels of individual genes and their relationships such as network topology and also co-expression of genes. We used an information theoretic approach to measure network state. This approach was successful in measuring network perturbations in terms of gene expressional changesref. 41ref. 42ref. 43. This entropy measure was also effective for detecting network state transition from the normal state to the disease stateref. 44ref. 45. A recent application of the network entropy successfully showed the difference between primary tumor and metastatic tumorref. 46. Additionally, Signaling entropy studies by Teschendorff group identified relationship between network entropy and differentiation potential, additionally the prognostic importanceref. 47ref. 48ref. 49.
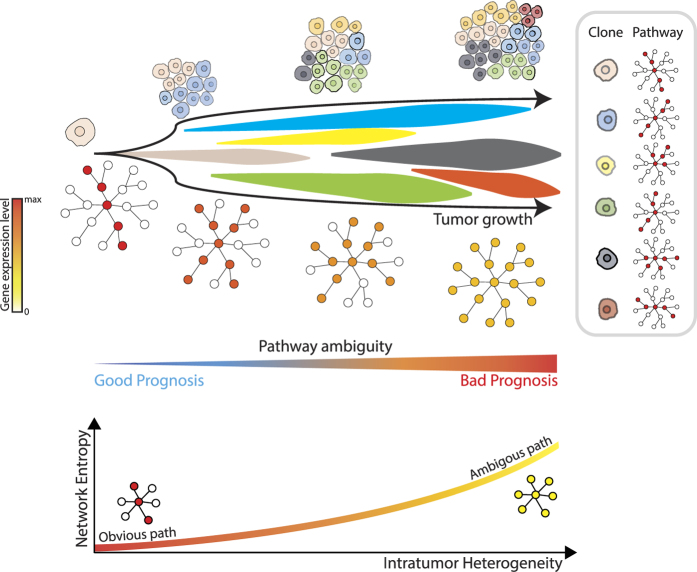
Our hypothesis is that a heterogeneous tumor will have more ambiguity in network than a homogeneous one (Fig. 1). Thus, we developed a novel measurement of ITH with transcriptome data using information theory, network-based Jensen-Shannon Divergence (nJSD)ref. 50. Our approach was extensively tested for issues related with ITH. For proof of concept, we used human cancer cell line data and single cell sequencing data. Then, the pan-cancer cohort data was analyzed. Our result was in agreement with widely used genome-based ITH inference methods. Additionally, our approach was also tested for immune cell infiltration. Finally, analysis of mouse clonal evolution showed that our network perturbation inference was consistent with ITH at different clonal evolution stages.
Methods
Calculation of nJSD
Jensen-Shannon Divergence is the measure similar to Kullback-Leibler divergence with some modifications to make JSD symmetric and bounded in a finite valueref. 51. nJSD is the sum of entropy values measured at each of the genes in a protein interaction network. To define entropy of each gene, it is necessary to define a probability distribution using gene expression values. We used log2-normalized gene expression values and assumed that the protein interactions were under the law of mass action.
Let ei denotes the expression level of gene-i and a set of neighbor genes of gene-i is Ji. Then, a probability of interaction between two genes is defined as
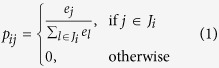
With pij, we defined a probability distribution of gene-i which has  neighbors on PIN on a sample X.

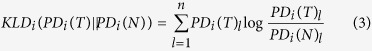
Let the lth-element in the probability distribution PDi(X) be PDi(X)l, then the Kullback-Liebler Divergence of gene-i between normal (N) and tumor (T) is definedref. 52.
Then the JSD of gene-i between normal and tumor was defined as
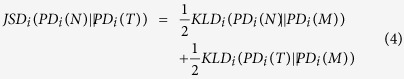
where 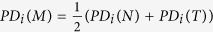 .
.
Finally, nJSD was defined as an average JSD of all genes. Graphical example of calculation of nJSD was described in (Supplementary Fig. 1).
Calculation of transcriptome-based ITH
To define transcriptome-based ITH (tITH), we set a maximally ambiguous network where whole gene-expression values were equal. nJSD was applied as a distance measure between two network states. Here, we defined tITH with two distance values, distance from normal data to cancer data (NT) and distance from cancer data to maximally ambiguous network (TA) (Fig. 2). This distance based approach was inspired by recent study about cancer evolution that described embryonic stem cell as cancer evolutionary destinationref. 53. Combining NT and TA into a single metric, we defined the transcriptome-based ITH and we named it as tITH in comparison with genomic ITH (gITH).

To investigate tITH at the pathway level, pathway–tITH was defined using only the gene set in a specific pathway. With this metric, we were able to precisely quantify pathway perturbation value ranging from 0 to 1.
Results
Proof of concept of state A with in silico simulated data and single-cell sequencing data
To calculate tITH, we assumed a maximally ambiguous state (state A). We made in silico data to investigate the relationship between sample heterogeneity and network ambiguity using single-cell sequencing data.
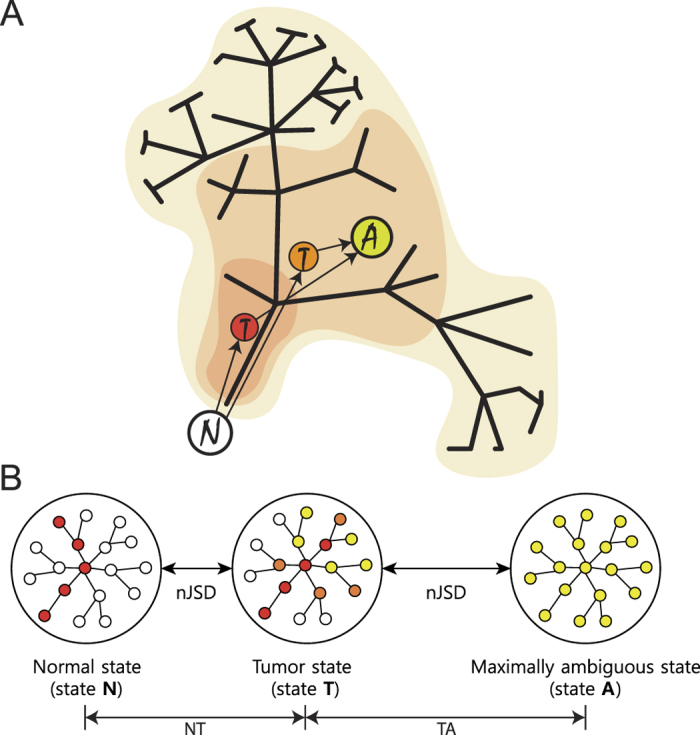
Each of cancer cell lines of different molecular characteristics such as drug resistance was cultured in well-controlled environments, so as to consider each cell line as different clone in heterogeneous tumor. With 675 different human cancer cell lines, we created heterogeneous tumor gene-expression data and calculated distance to state A by nJSD. The distance to state A decreased as more cell lines were mixed (Fig. 3A). This indicates that data from bulk-cell sequencing of tumor with diverse clones will show ambiguous network state similar to the state A. The difference in network status can be easily identified by visualizing the networks with gene expression values (Fig. 3C). In a plot of the gene expression value vs. the number of genes at a certain expression level, shape of the line in the cell line mixed data shifting to the one in the state A from the skewed shape in individual cell lines (Supplementary Fig. 3).
The relationship between sample heterogeneity and network ambiguity was re-examined with single-cell sequencing data as a real biological data. Diverse mutational patterns among different clones could contribute to differentially activated paths in network across clones, thus we expect that the bulk-cell tumor data will show more ambiguous network status than each of single-cell data. The LUAD data set consists of 3 different experimental sets (H358, LCT-PT-45 and LCT-PT-45Re with 35, 44 and 50 single-cell sequencing, respectively and additional pooled cell sequencing data)ref. 54. We compared patient derived bulk tumor and pooled sample with its single-cell sequencing data in three different LUAD data set. nJSD of 10,051 genes were calculated and compared in terms of distance from state A. Patient derived bulk tumor, “pt”, was significantly closer to state A than single cells in TS_45 data (Z-score = −4.01, p-value = 0.00003) (Fig. 3B). Pooled sample also had lower nJSD to state A than single cells in H358, LCT_PT_45 and LCT_PT_45Re data (Z-score = −5.27 and p-value < 0.00001, Z-score = −3.75 and p-value = 0.000087 and Z-score = −3.08 and p-value = 0.001042).
With in silico simulated data and single-cell sequencing data, it was possible to identify that the heterogeneous sample had ambiguous network state than homogeneous one. Our tITH measurement would showed how their gene-expression profile changed from normal tissue to maximally ambiguous state using nJSD.
tITH showed comparable result with gITH
This experiment is to show how well tITH agrees with gITH, genomic information based ITH, using the pan-cancer data set from TCGA. To compare tITH with gITH inferred clonal information was obtained from the study using PyClone and EXPANDref. 24. Since different mutational pattern will influence network perturbations genetic heterogeneity ought to be associated with tITHref. 55ref. 56.
tITH of pan-cancer cohort, 5,630 patients, showed intratumor heterogeneity of each patient. Among the tumor types, there were inter-tumor type differences in the distribution of nJSD (Fig. 4A). Notably, this inter-tumor type difference of tITH has the similar tendency to that of intratumor genetic ITH studyref. 24. THCA, PRAD and KIRC showed less heterogeneity than LUAD, HNSC, BLCA and LUSC (Supplementary Fig. 4). Next, we compared gITH results with our tITH result and found a positive correlation between genetic heterogeneity and tITH (Fig. 4B).
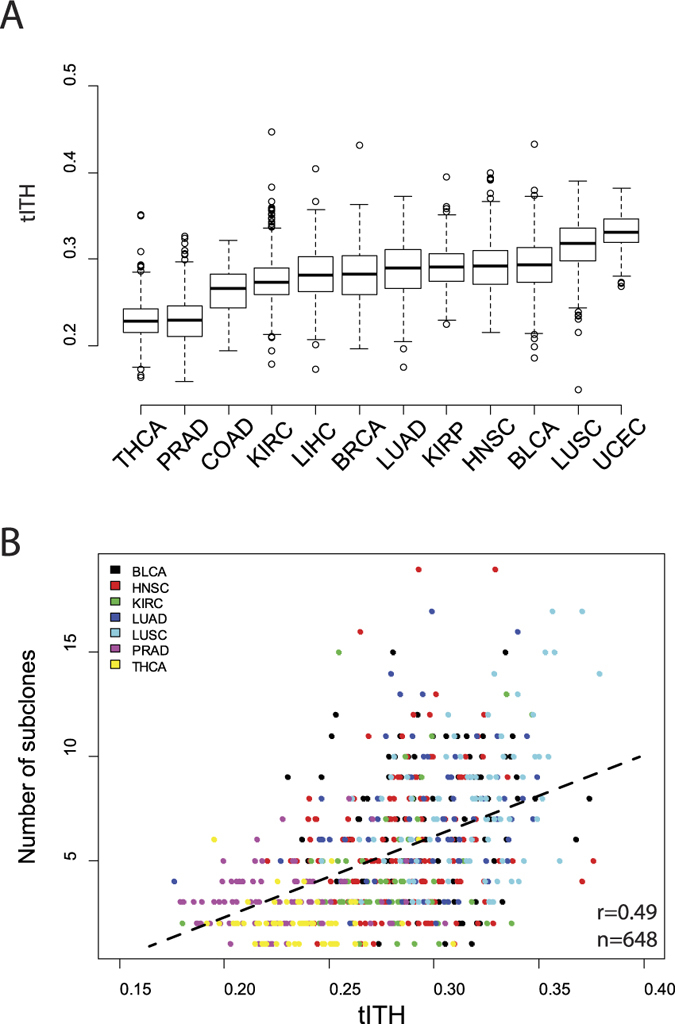
When we analyzed the cancer types separately, 4 cancer types showed similar patterns with the pan-cancer result (p-value < 0.05), HNSC (162 patients, r = 0.20), KIRC (64 patients, r = 0.27), LUAD (76 patients, r = 0.28) and LUSC (84 patients, r = 0.35), but other 3 cancer types had no relationship (p-value > 0.05), BLCA (111 patients, r = 0.13), PRAD (93 patients, r = 0.14), THCA (60 patients, r = −0.04). Pan-cancer trends were similar between tITH and gITH. However, there were some cancer types has weak correlation between tITH and gITH. This might due to the effect of cancer microenvironments, inter-tumor type difference and also small size of data set. In order to make sure that the pan-cancer result is not dependent on specific topology of PIN, we performed analysis using other PINs such as BioPlex and HINTref. 57ref. 58. Analysis of inter-PIN correlation showed that tITH was not dependent on a specific PIN topology (Supplementary Fig. 5).
In all 12 cancer data sets, the greater the number of subclones, the greater tITH values. Thus we were curious to know whether this correlation is a global trends in many different pathways in cellular mechanism. Using pathway-tITH, an average of nJSD values of genes in a pathway, we identified the pathways that pathway-tITH was correlated gITH. Most of the pathways, 255 out of 291, were significant in terms of representing ITH at the p-value < 0.001 (Pearson’s correlation test). Among the pathways identified by the pathway-tITH analysis, cell cycle and central dogma related pathways were highly correlated with the number of clones obtained from genomic ITH inference (Supplementary Table 1). This is consistent with the previous reports using genomic information that focused on variations of driver genes in cell cycle and central dogma related pathwaysref. 22ref. 59. Additionally, histological study reported cell cycle marker is correlated with gITHref. 24.
Relationship between nJSD and tumor purity
Gene expression data was used to estimate tumor purity and immune cell infiltrationsref. 60ref. 61ref. 62. Tumor purity is a measurement of sample contamination from other cell types, and immune cell infiltration is a score of immune cell proportion in a tumor sample. For tumor purity information, we used three scores– stromal score, immune score, and tumor purity score– by ESTIMATE in 1,557 patients across 8 different cancer typesref. 60.
We compared the tITH of each patient with the stromal score, immune score and the tumor purity score of the above mentioned methods. The stromal score was negatively associated with tITH (r = −0.502, p-value < 2.2e-16, Pearson’s correlation test). The immune score had a weak negative association (r = −0.203, p-value = 5.08e-16). The increasing proportion of specific cell types, such as stromal cells and immune cells, led to decreased tITH as expected. The tumor purity score was associated with tITH (r = 0.288, p-value < 2.2e-16), which is intuitive that the purer tumor will contain the more diverse clones. When analyzing cancer types separately, stromal scores had consistently negative correlation with tITH (Table 1). Immune score had negative association with tITH, and this result was consistent with the findings in a previous studyref. 25. Only the kidney cancer showed different patterns in tumor purity and immune score. This inverse pattern with other cancer types might be due to the higher immune cytolytic activity in kidney cancerref. 63.
Table 1: Relationship between tITH and tumor purity score from ESTIMATE.
| BLCA | BRCA | COAD | HNSC | LUAD | LUSC | KIRC | |
|---|---|---|---|---|---|---|---|
| Patients (n) | 95 | 471 | 18 | 291 | 228 | 129 | 326 |
| Purity (r) | 0.330 | 0.417 | 0.466 | 0.459 | 0.230 | 0.505 | 0.074 |
| Immune Score (r) | −0.389 | −0.184 | −0.481 | −0.251 | −0.382 | −0.487 | 0.177 |
| Stromal Score (r) | −0.575 | −0.585 | −0.616 | −0.515 | −0.384 | −0.476 | −0.342 |
Individual cancer type comparison of Pearson’s correlation coefficients.
Clinical potentials of tITH
Next, we were further curious if tITH has a prognostic power. We used the pan-cancer data comes with clinical information such as patient survival. We investigated the clinical utility of tITH in three different ways: survival analysis at the whole cancer cell level, pathway level, and analysis at the effect of immune cell filtration perspective.
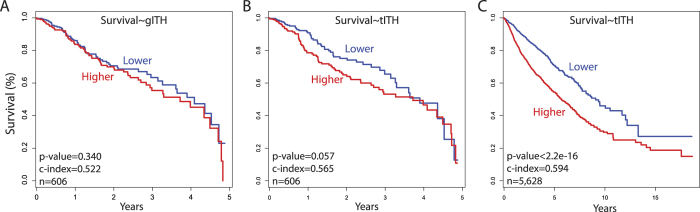
The first experiment was to investigate the prognostic power of tITH at whole cancer level (n = 606) using the Cox regression model, in comparison to that of the gITH information predicted by EXPAND. To test the prognostic power of gITH and tITH for each cancer type, we built two univariate Cox models. One was done with gITH and 5-year survival information. The other was done with tITH and 5-year survival information. The univariate Cox model using gITH was not significant (p-value = 0.3370, c-index = 0.543) while the model using tITH was statistically significant (p-value = 0.0006, c-index = 0.604). It is reported that the mutation based subclone number has a nonlinear association with survivalref. 24, which supports why the gITH model was not successful in separating patients groups into good or poor groups in Kaplan-Meier survival analysis. However, tITH has linear association with survival and tITH model was successful in separating patients groups (Fig. 5A,B). Next, we performed cox proportional hazard test with a bigger data set including patients without subclone information, a total of 5,628 patients. Pan-cancer univariate cox model using tITH values found clinical utility with significant statistics (c-index = 0.64, p < 2e-16). Kaplan-Meier survival analysis with poor and good group also shows significant separating of two groups (Fig. 5C).
The second experiment was to identify pathways that are relevant to or useful for the patient survival prediction. We analyzed pathway-tITH values measured for each pathway and cox proportional hazard test were done for each of the KEGG pathways. If cox model for a pathway was significant in terms of p-value < 0.001, then the pathway was selected as one that is significant for prognosis. A list of pathways that may have prognostic power is listed (Supplementary Table 2). In particular, mRNA surveillance pathway that controls mRNA abundance has the greatest c-index of 0.63. Additionally, Ribosome biogenesis in eukaryotes, Olfactory transduction, and RNA transport pathways also showed good prognostic power.
The third experiment was performed using two scores–immune score, and tumor purity score–from ESTIMATE result (n = 1,558). Previous results showed a negative correlation between tITH and immune score (Table 1). Because, recently prognostic importance of immune related cells was reported, we wanted to test that does immune score has dominant effect on clinical utility of tITHref. 64. Following the gITH study reported independency of gITH from immune cell infiltration, we reproduced independency of tITH excluding effect of the immune cell infiltrationref. 25. We performed two variable cox proportional hazard test with both the immune score and tITH. The immune score showed weak significance (p-value = 0.52101), while tITH had significance statistics (p-value = 0.00018). Therefore, it seems that the prognostic power is more likely from heterogeneity of tumor, rather than dominant effect of immune cell proportion. When a tumor purity score from ESTIMATE was applied as covariate with tITH, cox model was improved (c-index of tITH univariate cox model: 0.568 → tITH + purity score: 0.604).
tITH detected clonal evolution in xenograft model
We have shown that tITH can effectively measure the tumor heterogeneity from cohort data. Now we investigate whether tITH can measure the clonal evolution during tumor progression. Thus, we analyzed a time-series data of xenografted tumor by tITH in the extended time scale of tumor growth and divergence of subclones.
During the tumor progression from single-cell clone to metastatic tumor, the bulk-tumor sequencing data (12 time points) revealed the emergence of different clonal populationsref. 65. We measured tITH of 11 time point data with first time point data (MCF10A), MCF10A-HRAS, XT1-XT8, M1 and M2, and compared with reported number of clones from original research (Fig. 6A).
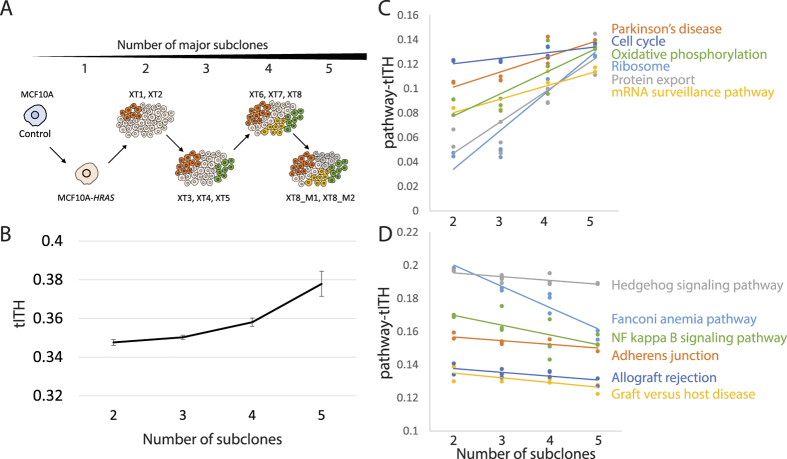
The perturbed network status of MCF10A-HRAS was closer to the network of MCF10A than the xenografted tumor samples (XT1-XT8, M1 and M2). However, we observed the abrupt elevation of tITH between MCF10A-HRAS and XT1 (from 0.109 to 0.346). The environmental change from the culture plate to the mouse system was the first big evolutional force which might result in the dramatic network perturbation changeref. 66. After the xenograft, the clones continuously produced different lineages and evolved. The authors of the original research reported that the very first clone generated 5 major subclonal populations, based on mutational lineage analysis. We were able to observe the increase in tITH during that clonal divergence. The divergence of major clones occurred at MCF10A-HRAS → XT1, XT2 → XT3, XT5 → XT6, and XT8 → M. tITH values steadily increased as the number of subclones increased (Fig. 6B). tITH increased at MCF10A-HRAS → XT1 (from 0.109 to 0.346), XT2 → XT3 (from 0.349 to 0.350), XT5 → XT6 (from 0.349 to 0.356) and XT8 → M (from 0.358 to 0.384 at M1, and 0.371 at M2).
Again, we performed the pathway-tITH analysis to further explore the relationship between clonal diversity and tITH. The correlation analysis showed that a number of pathways were either positively or negatively correlated with the number of subclones. Among those pathways, metabolic pathways were highly ranked in the correlation analysis. The metabolic pathway is well known to be important in cancer mechanismref. 67ref. 68. For example, Oxidative phosphorylation is involved in metabolic reprograming in cancer cellsref. 69 and its heterogeneity is also observed clear in our correlation analysis (Fig. 6C). The whole pathway list is in Supplementary Table 3. As there are many kinds of metabolic pathways related to cancer, we focus on other pathways, excluding metabolic pathways for further pathway-tITH analysis.
We found that, in 131 out of 291 pathways, pathway-tITH values were positively correlated with tumor progression over time (r > 0.3, from XT1 to XT8-M2). Cell cycle and central dogma related pathways such as Parkinson’s disease, Ribosome, mRNA surveillance pathway, Cell cycle, and DNA replication were at the top of the positively correlated pathway list in HRAS mutated cell lines (Fig. 6C). This finding was confirmed in a study that reports the central dogma and cell cycle related pathways became more heterogeneous as the mutated HRAS activated MAP kinase cascades downstream and effects on transcriptional control and cell growthref. 70. This result implies that ITH is highly related with the aberration in the flow of cellular information and cell cycle transition from the quiescent stem-cell like state to accelerated proliferative state. Like Cell cycle pathway, Parkinson’s disease pathway became more heterogeneous as clones diverged. Although the pathway is a kind of brain disease, it contained many genes related to cell cycleref. 71. Recent cohort study revealed the relationship between parkinson’s disease and cancerref. 72. Also in molecular-level studies, the PARK2 and LRRK2 genes well known in parkinson’s disease were revealed that those genes were related with cell cycle pathwaysref. 73ref. 74.
There were 60 of 291 pathways negatively correlated with tumor evolution measured by pathway-tITH (r < −0.3). The tITH values of these pathways were steady or decreased as the number of subclones increased (Fig. 6D). Thus, we conjecture that these pathways were not affected from ITH but the perturbation at the early stage of carcinogenesis remained and converged among different clones. Pathway-tITH of six pathways had a negative association with the number of subclones, especially Fanconi anemia pathway showed dramatic decrease (Fig. 6D). This indicates that Fanconi anemia pathway related to DNA repair system was heterogeneous in early time points but converged for some reasons such as the influence of the host system or the process of clonal evolution (Fig. 6D). In the original study, missense mutations on RAD54B and PMS1 were reported, and they were connected by direct edges to Fanconni anemia pathway in STRING PIN (PMS1–FAN1 and RAD51–RAD54B)ref. 65. This pathway is a genetic disease about DNA repair genes–BRCA1, RAD51, PMS2 and FANC proteins–which are higly related to cancers. Like Fanconi anemia pathway, some pathways, such as Hedgehog signaling pathway, NF kappa B signaling pathway, Adherens junction and immune related pathways, were converged to a certain state of cancer during tumor growth (r < −0.6 from XT1 to XT8-M2).
Discussion
Cancer evolution has become an important issue in understanding cancer biological mechanisms. An cancer evolution study by He et al.ref. 53, using JSD as a distance measure, reported that embryonic stem cell is the destination in cancer evolution. Their finding is that unicellularity is key characteristic of cancerref. 75ref. 76ref. 77. Accordingly, the relationship between ESC and cancer was well studied, but the clinical application is yet to be a realityref. 78ref. 79. In this respect, Teschendorff group showed a possibility of clinical application in terms of cancer evolutionref. 49. Their study focused on signaling pathways, or regimes in their term, and observed the reverse differentiation of cancer cellsref. 48. The study used a network perturbation concept in terms of entropy and reported the association between differentiation potential and network entropy, thus they defined the measure termed as Signaling entropy. This way, the study showed the clinical importance of the signaling entropy in cancer, and reported the relationship with ITHref. 49. The study discussed about a possibility of measuring ITH using the network entropy.
However, Signaling entropy was difficult to distinguish differentiation potential from ITH because the network measure is the metric of entire PIN. On the contrary, our entropy measure is gene centric and then combines gene level information to pathway level and also to the entire PIN level. We used the metric to measure ITH in terms of subclone diversity, rather than focusing on the differential potential.
Our analysis results in Fig. 4B with the tITH approach in the xenograft tumor evolution data can be interpreted as an increment of differentiation potential in terms of the reverse-evolution hypothesis of the previous works. To investigate further, we analyzed heterogeneous data by incrementally adding transcriptome data form different cancer cell lines (Fig. 3). Differentiation potentials in different cell lines may not be significantly different, thus the increased network entropy observed in our study with the mixed cell line data may be from other factors, possibly from some pathways, rather than differentiation related pathways. This hypothesis was supported by the analysis of the clonal evolution data. tITH values of differentiation potential related pathways were either steady or slightly decreased (Fig. 6D). This implies that cancer clones lose their control of differentiation at the early carcinogenesis stage. After tumorigenesis, continuous increment in tITH values may be the result from heterogeneity in cell cycle and central dogma related pathways. This conjecture is supported by the previous work with histological informationref. 24.
Although our study highlights the importance of cell cycle pathways in terms of tumor heterogeneity, reverse differentiation is well documented and important factor in cancer evolutionref. 77. In cellular mechanism, multiple signaling pathways work as control switch between differentiation and proliferation stateref. 80. In our analysis, tITH value of the Hedgehog signaling pathway, an important information transmitor during embryogenesisref. 81, remains unchanged for different number of subclones, while cell cycle related pathways become more ambiguous. However, it is still unclear how the loss of differentiation and the accelerated cell proliferation interplay. Clones may have loss of differentiation because of the fast and uncotrolled cell cycle, however simultaneously cancer stem cell population did not differentiate even they were quiescent state of cell cycleref. 82ref. 83. The aberration of the master regulator of differentiation and proliferation – like hedgehog signaling that we found – may be the main cause of dysregulation of differentiation. A breakthrough in cancer may be in thereref. 76.
Our method successfully measured ITH with transcriptome data and network information, but our method did not use whole features of transcriptome data. Biological network information includes only a small number of genes; 20,000~40,000 transcripts are generally observed in the whole transcriptome data but only ~10,000 genes are used in the interaction data. There could be another approaches with de novo network construction with edge probability using statistical approachesref. 84ref. 85. As more comprehensive interaction data, including regulatory data, is available, our method can be more accurate in predicting ITH.
Although our study was able to show tumor heterogeneity using four datasets, our computational methods still need to be improved. Our approach focused on detecting ITH with bulk RNA-sequencing data. There are other notable methods which deconvolute gene-expression data to identify population of specific cell typesref. 86. Especially, immune related cell population in tumor sample were well studiedref. 31ref. 64. These methods, although successful in de-composing cell populations, require a reference gene expression profile. The requirement for a reference gene expression profile makes difficult to measure ITH since the number of clones is not known; this is a typical chicken and egg problem. Our current method is to measure the heterogeneity in a systematic view but it is not designed to de-compose cancer clones. As a future study, we are working on a computational method that can both de-compose clones and measure the status of heterogeneity.
We propose a new approach, tITH, to inference ITH using RNA-seq data by nJSD and compared with gITH. Our tITH was in agreement with gITH. Since our method is to measure the status of gene expression, it is possible to perform functional or pathway-level analysis. With xenograft model, we found importance of cell cycle related pathways in ITH. Other signaling pathway showed converging tendency during clonal evolutions. In addition, we showed that tITH achieved better performance than gITH in cox regression model analysis for survival prediction. We believe that ITH should be investigated at the full spectrum of the central dogma, i.e., at DNA, RNA, and protein levels. Our tITH can be useful for ITH inference using RNA-sequencing data of the bulk tumor, which may be useful for developing cost effective molecular diagnosis methods.
Materials
Gene Expression Data
We used four different datasets to examine the usefulness of nJSD. The lung adenocarcinoma (LUAD) single-cell RNA-sequencing data from GEO under the accession number of GSE69405ref. 54. Human cancer cell lines data, 675 different human origin cell lines was obtained from GEO under the accession number of GSE30611ref. 87. The xenograft-tumor data was obtained from GSE63630. The Ensembl gene ID was converted to gene symbol using mygene 2.3.0 python package. The log transformed gene expression data was downloaded from the supplementary data of the published researchref. 65. The pan-cancer data, TCGA RNA Seq V2, was obtained from TCGA data portal (https://tcga-data.nci.nih.gov/tcga/). We selected cancer types which have more than 10 normal samples: Bladder Urothelial Carcinoma (BLCA), Breast invasive carcinoma (BRCA), Colon adenocarcinoma (COAD), Head and Neck squamous cell carcinoma (HNSC), Kidney renal clear cell carcinoma (KIRC), Kidney renal papillary cell carcinoma (KIRP), Lung adenocarcinoma (LUAD), Lung squamous cell carcinoma (LUSC), Prostate adenocarcinoma (PRAD), Thyroid carcinoma (THCA) and Uterine Corpus Endometrial Carcinoma (UCEC).
Pathway and Protein Interaction network
Protein-protein interaction network was constructed with STRING v9 dataref. 88. 479,635 edges and 10,100 genes consist PIN. BioPlex and HINT were used in inter-PIN comparison studyref. 57ref. 58. BioPlex network has 10,963 genes and 56,554 edges and HINT has 12,194 genes and 53,126 edges. The KEGG pathway data contained 295 pathways and 6,969 genes.
In silico simulation with 675 human cancer cell lines data
We created in silico heterogeneous tumor data with gene-expression data of 675 human cancer cell lines. Randomly selected 2, 4, 8, 16, 32, 64, 128, 256, and 512 out of 675 cell line gene-expression data was individually averaged into a single gene-expression profile. Each simulation data had 1,000 gene-expression profiles.
tITH calculation of TCGA patients and comparison to gITH results
We calculated tITH and pathway-tITH based on mean expression level of multiple normal samples of each cancer type. The intratumor heterogeneity, number of clones, in TCGA patients data were obtained from a previously published researchref. 24. This intratumor heterogeneity information was calculated based on mutations using state-of-the-art tools, PyClone and EXPANDs. The tumor purity information of TCGA patients is obtained from a previously published researchref. 60. This tool for tumor purity estimation, ESTIMATE, produces score about immune cell infiltration, stromal cell population and tumor purity. The TCGA pan-cancer clinical data were downloaded from TCGA data portal. Cox regression model analysis was done by using R library survivalref. 89.
Additional Information
How to cite this article: Park, Y. et al. Measuring intratumor heterogeneity by network entropy using RNA-seq data. Sci. Rep.6, 37767; doi: 10.1038/srep37767 (2016).
Publisher’s note: Springer Nature remains neutral with regard to jurisdictional claims in published maps and institutional affiliations.
Supplementary Materials
References
- D. P. Tabassum, K. Polyak. Tumorigenesis: it takes a village.. Nature Reviews Cancer, 2015. [PubMed]
- N. McGranahan, C. Swanton. Biological and therapeutic impact of intratumor heterogeneity in cancer evolution.. Cancer cell, 2015. [PubMed]
- P. C. Nowell. The clonal evolution of tumor cell populations.. Science, 1976. [PubMed]
- R. A. Burrell, N. McGranahan, J. Bartek, C. Swanton. The causes and consequences of genetic heterogeneity in cancer evolution.. Nature, 2013. [PubMed]
- M. T. Chang. Identifying recurrent mutations in cancer reveals widespread lineage diversity and mutational specificity.. Nature biotechnology, 2016
- G. Gundem. The evolutionary history of lethal metastatic prostate cancer.. Nature, 2015. [PubMed]
- N. C. Turner, J. S. Reis-Filho. Genetic heterogeneity and cancer drug resistance.. The lancet oncology, 2012. [PubMed]
- M. Greaves, C. C. Maley. Clonal evolution in cancer.. Nature, 2012. [PubMed]
- I. Bozic. Evolutionary dynamics of cancer in response to targeted combination therapy.. Elife, 2013. [PubMed]
- V. Almendro. Inference of tumor evolution during chemotherapy by computational modeling and in situ analysis of genetic and phenotypic cellular diversity.. Cell reports, 2014. [PubMed]
- A. Sottoriva. A big bang model of human colorectal tumor growth.. Nature genetics, 2015. [PubMed]
- S. Ling. Extremely high genetic diversity in a single tumor points to prevalence of non-darwinian cell evolution.. Proceedings of the National Academy of Sciences, 2015
- M. Gerlinger. Intratumor heterogeneity and branched evolution revealed by multiregion sequencing.. New England journal of medicine, 2012. [PubMed]
- Y. Wang, N. E. Navin. Advances and applications of single-cell sequencing technologies.. Molecular cell, 2015. [PubMed]
- A. P. Patel. Single-cell rna-seq highlights intratumoral heterogeneity in primary glioblastoma.. Science, 2014. [PubMed]
- J. W. Drake, B. Charlesworth, D. Charlesworth, J. F. Crow. Rates of spontaneous mutation.. Genetics, 1998. [PubMed]
- L. B. Alexandrov. Clock-like mutational processes in human somatic cells.. Nature genetics, 2015. [PubMed]
- P. J. Campbell. Subclonal phylogenetic structures in cancer revealed by ultra-deep sequencing.. Proceedings of the National Academy of Sciences, 2008
- S. L. Carter. Absolute quantification of somatic dna alterations in human cancer.. Nature biotechnology, 2012
- G. Ha. Titan: inference of copy number architectures in clonal cell populations from tumor whole-genome sequence data.. Genome research, 2014. [PubMed]
- R. Shen, V. E. Seshan. Facets: allele-specific copy number and clonal heterogeneity analysis tool for high-throughput dna sequencing.. Nucleic acids research gkw520 (, 2016
- A. Roth. Pyclone: statistical inference of clonal population structure in cancer.. Nature methods, 2014. [PubMed]
- N. Andor, J. V. Harness, S. Mueller, H. W. Mewes, C. Petritsch. Expands: expanding ploidy and allele frequency on nested subpopulations.. Bioinformatics, 2014. [PubMed]
- N. Andor. Pan-cancer analysis of the extent and consequences of intratumor heterogeneity.. Nature medicine, 2016
- L. Morris. Pan-cancer analysis of intratumor heterogeneity as a prognostic determinant of survival.. Oncotarget, 2016. [PubMed]
- F. Cheng. A gene gravity model for the evolution of cancer genomes: a study of 3,000 cancer genomes across 9 cancer types.. Plos Comput Biol, 2015. [PubMed]
- M. J. Williams, B. Werner, C. P. Barnes, T. A. Graham, A. Sottoriva. Identification of neutral tumor evolution across cancer types.. Nature genetics (, 2016
- C. E. Meacham, S. J. Morrison. Tumour heterogeneity and cancer cell plasticity.. Nature, 2013. [PubMed]
- A. Kreso. Variable clonal repopulation dynamics influence chemotherapy response in colorectal cancer.. Science, 2013. [PubMed]
- A. Marusyk. Non-cell-autonomous driving of tumour growth supports sub-clonal heterogeneity.. Nature, 2014. [PubMed]
- T. Kitamura, B.-Z. Qian, J. W. Pollard. Immune cell promotion of metastasis.. Nature Reviews Immunology, 2015
- G. L. Semenza. Cancer–stromal cell interactions mediated by hypoxia-inducible factors promote angiogenesis, lymphangiogenesis, and metastasis.. Oncogene, 2013. [PubMed]
- A. S. Cleary, T. L. Leonard, S. A. Gestl, E. J. Gunther. Tumour cell heterogeneity maintained by cooperating subclones in wnt-driven mammary cancers.. Nature, 2014. [PubMed]
- I. Tirosh. Dissecting the multicellular ecosystem of metastatic melanoma by single-cell rna-seq.. Science, 2016. [PubMed]
- D. Brawand. The evolution of gene expression levels in mammalian organs.. Nature, 2011. [PubMed]
- P. H. Sudmant, M. S. Alexis, C. B. Burge. Meta-analysis of rna-seq expression data across species, tissues and studies.. Genome biology, 2015. [PubMed]
- H. J. Cordell. Detecting gene–gene interactions that underlie human diseases.. Nature Reviews Genetics, 2009
- P. Khatri, M. Sirota, A. J. Butte. Ten years of pathway analysis: current approaches and outstanding challenges.. Plos Comput Biol, 2012. [PubMed]
- P. Creixell. Pathway and network analysis of cancer genomes.. Nature methods, 2015. [PubMed]
- N. J. Krogan, S. Lippman, D. A. Agard, A. Ashworth, T. Ideker. The cancer cell map initiative: defining the hallmark networks of cancer.. Molecular cell, 2015. [PubMed]
- R. Berretta, P. Moscato. Cancer biomarker discovery: the entropic hallmark.. PLoS One, 2010. [PubMed]
- D. Breitkreutz, L. Hlatky, E. Rietman, J. A. Tuszynski. Molecular signaling network complexity is correlated with cancer patient survivability.. Proceedings of the National Academy of Sciences, 2012
- P. Csermely. Cancer stem cells display extremely large evolvability: alternating plastic and rigid networks as a potential mechanism: network models, novel therapeutic target strategies, and the contributions of hypoxia, inflammation and cellular senescence. In. Seminars in cancer biology, 2015. [PubMed]
- R. Liu. Identifying critical transitions and their leading biomolecular networks in complex diseases.. Scientific reports, 2012
- F. Cheng, C. Liu, B. Shen, Z. Zhao. Investigating cellular network heterogeneity and modularity in cancer: a network entropy and unbalanced motif approach.. BMC Systems Biology, 2016. [PubMed]
- G. Menichetti, G. Bianconi, G. Castellani, E. Giampieri, D. Remondini. Multiscale characterization of ageing and cancer progression by a novel network entropy measure.. Molecular BioSystems, 2015. [PubMed]
- A. E. Teschendorff, S. Severini. Increased entropy of signal transduction in the cancer metastasis phenotype.. BMC systems biology, 2010. [PubMed]
- C. R. Banerji. Cellular network entropy as the energy potential in waddington’s differentiation landscape.. Scientific reports, 2013
- C. R. Banerji, S. Severini, C. Caldas, A. E. Teschendorff. Intra-tumour signalling entropy determines clinical outcome in breast and lung cancer.. Plos Comput Biol, 2015. [PubMed]
- J. Lin. Divergence measures based on the shannon entropy.. Information Theory, IEEE Transactions on, 1991
- D. M. Endres, J. E. Schindelin. A new metric for probability distributions.. IEEE Transactions on Information theory (, 2003
- S. Kullback, R. A. Leibler. On information and sufficiency.. The annals of mathematical statistics, 1951
- H. Chen, X. He. The convergent cancer evolution toward a single cellular destination.. Molecular biology and evolution, 2016. [PubMed]
- K.-T. Kim. Single-cell mrna sequencing identifies subclonal heterogeneity in anti-cancer drug responses of lung adenocarcinoma cells.. Genome Biol, 2015. [PubMed]
- F. Cheng. Studying tumorigenesis through network evolution and somatic mutational perturbations in the cancer interactome.. Molecular biology and evolution, 2014. [PubMed]
- P. Jia, Z. Zhao. Impacts of somatic mutations on gene expression: an association perspective.. Briefings in bioinformatics bbw037 (, 2016
- E. L. Huttlin. The bioplex network: a systematic exploration of the human interactome.. Cell, 2015. [PubMed]
- J. Das, H. Yu. Hint: High-quality protein interactomes and their applications in understanding human disease.. BMC systems biology, 2012. [PubMed]
- D. Tamborero. Comprehensive identification of mutational cancer driver genes across 12 tumor types.. Scientific reports, 2013. [PubMed]
- K. Yoshihara. Inferring tumour purity and stromal and immune cell admixture from expression data.. Nature communications, 2013
- D. Aran, M. Sirota, A. J. Butte. Systematic pan-cancer analysis of tumour purity.. Nature communications, 2015
- C. Isella. Stromal contribution to the colorectal cancer transcriptome.. Nature genetics, 2015. [PubMed]
- M. S. Rooney, S. A. Shukla, C. J. Wu, G. Getz, N. Hacohen. Molecular and genetic properties of tumors associated with local immune cytolytic activity.. Cell, 2015. [PubMed]
- A. J. Gentles. The prognostic landscape of genes and infiltrating immune cells across human cancers.. Nature medicine, 2015
- H. Chen, F. Lin, K. Xing, X. He. The reverse evolution from multicellularity to unicellularity during carcinogenesis.. Nature communications, 2015
- R. Martinez-Garcia. Transcriptional dissection of pancreatic tumors engrafted in mice.. Genome medicine, 2014. [PubMed]
- O. Warburg. On the origin of cancer cells.. Science, 1956. [PubMed]
- P. S. Ward, C. B. Thompson. Metabolic reprogramming: a cancer hallmark even warburg did not anticipate.. Cancer cell, 2012. [PubMed]
- R. A. Gatenby, R. J. Gillies. Why do cancers have high aerobic glycolysis?. Nature Reviews Cancer, 2004. [PubMed]
- L. Chang, M. Karin. Mammalian map kinase signalling cascades.. Nature, 2001. [PubMed]
- A. B. West, V. L. Dawson, T. M. Dawson. To die or grow: Parkinson’s disease and cancer.. Trends in neurosciences, 2005. [PubMed]
- P.-Y. Lin. Association between parkinson disease and risk of cancer in taiwan.. JAMA oncology, 2015. [PubMed]
- Y. Gong. Pan-cancer genetic analysis identifies park2 as a master regulator of g1/s cyclins.. Nature genetics, 2014. [PubMed]
- B. D. Looyenga. Chromosomal amplification of leucine-rich repeat kinase-2 (lrrk2) is required for oncogenic met signaling in papillary renal and thyroid carcinomas.. Proceedings of the National Academy of Sciences, 2011
- P. C. Davies, C. H. Lineweaver. Cancer tumors as metazoa 1.0: tapping genes of ancient ancestors.. Physical biology, 2011. [PubMed]
- C. A. Aktipis. Cancer across the tree of life: cooperation and cheating in multicellularity.. Phil. Trans. R. Soc. B, 2015. [PubMed]
- M. Greaves. Evolutionary determinants of cancer.. Cancer discovery, 2015. [PubMed]
- I. Ben-Porath. An embryonic stem cell–like gene expression signature in poorly differentiated aggressive human tumors.. Nature genetics, 2008. [PubMed]
- S. M. Kumar. Acquired cancer stem cell phenotypes through oct4-mediated dedifferentiation.. Oncogene, 2012. [PubMed]
- S. Klusza, W.-M. Deng. At the crossroads of differentiation and proliferation: Precise control of cell-cycle changes by multiple signaling pathways in drosophila follicle cells.. Bioessays, 2011. [PubMed]
- E. B. Lewis. A gene complex controlling segmentation in drosophila. In. Genes, Development and Cancer, 1978
- A. Roesch. A temporarily distinct subpopulation of slow-cycling melanoma cells is required for continuous tumor growth.. Cell, 2010. [PubMed]
- N. Moore, S. Lyle. Quiescent, slow-cycling stem cell populations in cancer: a review of the evidence and discussion of significance.. Journal of oncology, 2010
- W. Zhang, T. Zeng, L. Chen. Edgemarker: identifying differentially correlated molecule pairs as edge-biomarkers.. Journal of theoretical biology, 2014. [PubMed]
- W. Zhang, T. Zeng, X. Liu, L. Chen. Diagnosing phenotypes of single-sample individuals by edge biomarkers.. Journal of molecular cell biology mjv025 (, 2015
- A. M. Newman. Robust enumeration of cell subsets from tissue expression profiles.. Nature methods, 2015. [PubMed]
- C. Klijn. A comprehensive transcriptional portrait of human cancer cell lines.. Nature biotechnology, 2015
- A. Franceschini. String v9.1: protein-protein interaction networks, with increased coverage and integration.. Nucleic acids research, 2013. [PubMed]
- T. M. Therneau. A Package for Survival Analysis in R,, 2015