Large-scale RNA-Seq Transcriptome Analysis of 4043 Cancers and 548 Normal Tissue Controls across 12 TCGA Cancer Types
Abstract
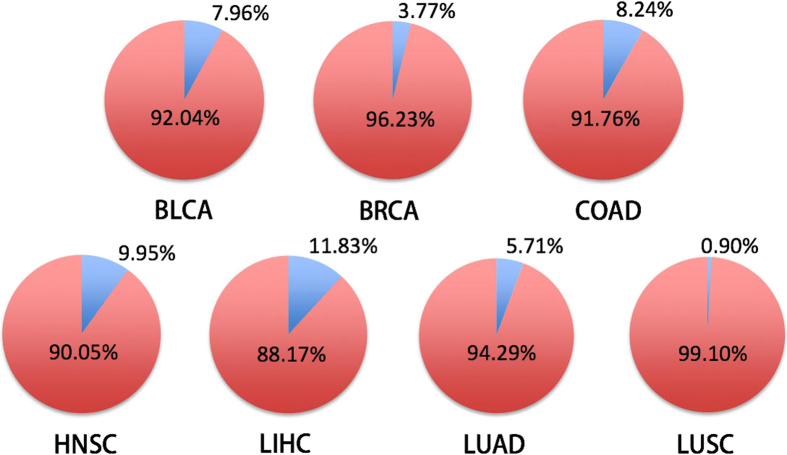
The Cancer Genome Atlas (TCGA) has accrued RNA-Seq-based transcriptome data for more than 4000 cancer tissue samples across 12 cancer types, translating these data into biological insights remains a major challenge. We analyzed and compared the transcriptomes of 4043 cancer and 548 normal tissue samples from 21 TCGA cancer types, and created a comprehensive catalog of gene expression alterations for each cancer type. By clustering genes into co-regulated gene sets, we identified seven cross-cancer gene signatures altered across a diverse panel of primary human cancer samples. A 14-gene signature extracted from these seven cross-cancer gene signatures precisely differentiated between cancerous and normal samples, the predictive accuracy of leave-one-out cross-validation (LOOCV) were 92.04%, 96.23%, 91.76%, 90.05%, 88.17%, 94.29%, and 99.10% for BLCA, BRCA, COAD, HNSC, LIHC, LUAD, and LUSC, respectively. A lung cancer-specific gene signature, containing SFTPA1 and SFTPA2 genes, accurately distinguished lung cancer from other cancer samples, the predictive accuracy of LOOCV for TCGA and GSE5364 data were 95.68% and 100%, respectively. These gene signatures provide rich insights into the transcriptional programs that trigger tumorigenesis and metastasis, and many genes in the signature gene panels may be of significant value to the diagnosis and treatment of cancer.
Affiliations: State Key Laboratory of Silkworm Genome Biology, Southwest University, Chongqing 400715, China; Institute of Pathology and Southwest Cancer Center, Southwest Hospital, Third Military Medical University, Chongqing 400038, China; Department of Computer Science and Technology, Department of Statistics, Southwest University, Chongqing 400715, China; Department of Oncology, Chengdu Military General Hospital of PLA, Chengdu 610083, China; Department of Pathology, Clinical School, Dali University, Dali 671000, China
License: Copyright © 2015, Macmillan Publishers Limited CC BY 4.0 This work is licensed under a Creative Commons Attribution 4.0 International License. The images or other third party material in this article are included in the article’s Creative Commons license, unless indicated otherwise in the credit line; if the material is not included under the Creative Commons license, users will need to obtain permission from the license holder to reproduce the material. To view a copy of this license, visit http://creativecommons.org/licenses/by/4.0/
Article links: DOI: 10.1038/srep13413 | PubMed: 26292924 | PMC: PMC4544034
Relevance: Moderate: mentioned 3+ times in text
Full text: PDF (1.7 MB)
Recent advances in cancer genomics have created a rich resource for studying the causes of cancer. The Cancer Genome Atlas (TCGA)ref. 1 (http://cancergenome.nih.gov) has accrued more than 10,000 cases of human cancer including over 25 different cancer types. Datasets including RNA-Seq, miRNA-Seq, Exon-Seq, somatic mutations, methylation, CNV for each case are publically available via the TCGA Data Portal (https://tcga-data.nci.nih.gov/tcga/tcgaHome2.jsp) and UCSC Cancer Genomics Hub (https://cghub.ucsc.edu). Translating these data into biological insights remains a major challenge. Currently several studies have analyzed genome-wide mutational patterns in different cancer types and identified genes harboring functional mutations implicated in cancerogenesisref. 2ref. 3ref. 4ref. 5. Cancer is thought to be driven by gene expression pattern changes due to the accumulation of mutations or epigenetic modifications; thus, a comprehensive characterization of alterations in gene expression will not only advance our understanding of cancer biology, it will also provide a large number of new potential diagnostic and therapeutic targets for cancer. Cheng et al.ref. 6 introduced a method to identify cancer-associated attractors and revealed some interesting bimolecular events shared among multiple cancer types based on microarray gene expression data. However, genome-wide association analysis of RNA-Seq transcriptome data across various TCGA cancer types has rarely been reported. RNA-Seq, a revolutionary technology for genome-wide gene expression profiling, offers several key advantages compared to microarraysref. 7, it could better characterize the transcriptomic changes associated with human cancers.
In this study, we analyzed and compared the RNA-Seq transcriptomes of 4043 cancer and 548 solid tissue normal samples across 21 types of cancer from TCGA. We created a catalog of gene expression alterations for each cancer type, and our results show that the alterations in gene expression vary substantially between different tumor types. Studies have shown that cancer involves many different genes and a majority of these genes have a small to moderate effectref. 8, it is difficult to detect these effects by single gene analysis. By clustering genes into co-regulated gene sets, we are able to examine accumulative effects of a group of functionally related genes. We performed gene set association analysis for each cancer type; our results revealed several common gene signatures shared by multiple cancer types and a lung cancer-specific gene signature. We also validated these signatures using several non-TCGA data sets. These cross-cancer and cancer-specific transcriptional aberrations improve our understanding of the etiology of human cancers, and are of great importance for the diagnosis and treatment of cancer.
Results
Gene-level differential expression analysis of transcriptomes
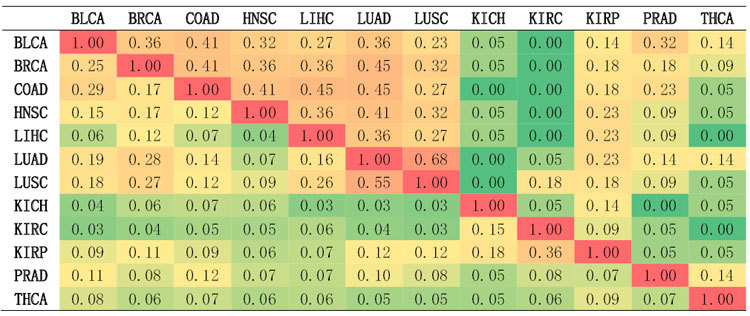
We conducted gene differential expression analysis and created a catalog of gene expression alterations for each of 12 cancer types; the results are shown in Supplementary Table S1. Our results show that a large number of genes were differentially expressed. Among a total of 20530 genes, the percentage of differentially expressed (DE) genes with FDR < 0.01 is 0.32, 0.72, 0.51, 0.52, 0.52, 0.65, 0.68, 0.54, 0.69, 0.46, 0.46, and 0.56 for BLCA, BRCA, COAD, HNSC, LIHC, LUAD, LUSC, KICH, KIRC, KIRP, PRAD, and THCA, respectively. To examine the similarity of DE genes between cancer types, we extracted the top 3% most differentially expressed genes from each cancer type. We then calculated the number of common DE genes between cancer types. As shown in Table 1, we found that DE genes vary substantially across cancer types, and there are less than 20% common DE genes between most cancer types. LUAD and LUSC, two forms of lung cancers, turn out to be most similar cancers since they share 55% of DE genes. Contrarily, the DE profiles of two kidney cancers, KICH and KIRC, are quite different from each other and others; the percentage of common DE genes is less than 10%. Additionally, THCA is also poorly overlapped with other cancers in terms of DE genes. The diversity in differential expression could be explained by several factors: (1) many of gene expression alterations may be cancer type-specific; (2) aberrations in different genes may have same phenotypic consequences; (3) single gene analysis may miss many subtle effects on causative genes.
Table 1: The percentage of common genes and gene sets in top 3% most differentially expressed genes and gene sets between 12 cancer types*.
Gene clustering
Prior to gene set association analysis, we clustered genes based on their expression profiles over all normal samples across 12 cancer types. We obtained a total of 3236 clusters (Supplementary Table S2). The expression changes of genes in a cluster are highly correlated under various conditions, thus, it is reasonable to assume that genes in the same cluster are co-regulated or belong to the same pathway.
Gene set association analysis of TCGA data
Cancers arise from the aberrations in multiple genes, many of which only have moderate or weak effect sizes that are difficult to detect by only analyzing individual genes, therefore, we adopted gene set association analysis to detect the accumulative effect of a group of functionally related genes and to reveal the transcriptional program accounting for the variability in phenotype.
Carcinogenesis is caused by the accumulation of mutations and epimutations in normal cellsref. 9ref. 10, which confer a growth and selective advantage upon these cells, resulting in uncontrolled cell division and the evolution of these cells by natural selectionref. 11. The mutations can be classified into two classes, driver mutation and passenger mutation, according to their phenotypic effectsref. 12. Driver mutations are causally implicated in carcinogenesis while passenger mutations don’t contribute to the development of cancer. A driver mutation is expected to alter the gene expression of its target genes and/or genes that share the same biological pathwayref. 13ref. 14, and these changes in gene expression account for the phenotypic varianceref. 15.
The cell cycle lies at the core of cancerref. 16ref. 17. In normal cells, the cell cycle is controlled by a series of signaling pathways by which a cell grows, replicates its DNA and divides. In cancers, as a result of mutations, this regulatory process malfunctions, resulting in uncontrolled cell proliferation that leads to carcinogenesisref. 18ref. 19. From the perspective of pathway, we hypothesize that there may be two potential carcinogenic mechanisms, as illustrated in Fig. 1: (1) one or more driver mutations are within a cell cycle-associated pathway, altering its expression pattern and consequently leading to cancer; (2) one or more driver mutations lie in an organ/tissue-specific pathway or other pathways not related to cell cycle, which interacts with a cell cycle-associated pathway, alters its expression pattern, and ultimately results in cancer. Since the deregulation of cell cycle is a common characteristic shared by multiple cancer types, we expected that the expression of cell cycle-associated pathways would be altered across a range of cancers. By analyzing and comparing the transcriptome data of 12 cancer types, we can test this hypothesis.
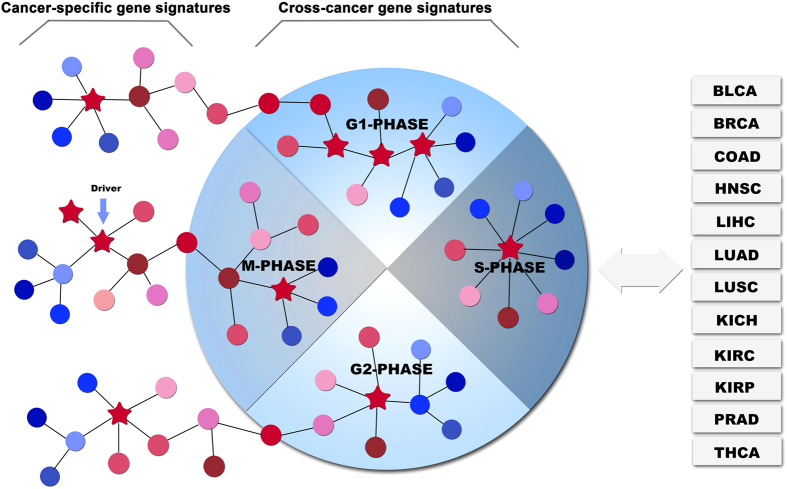
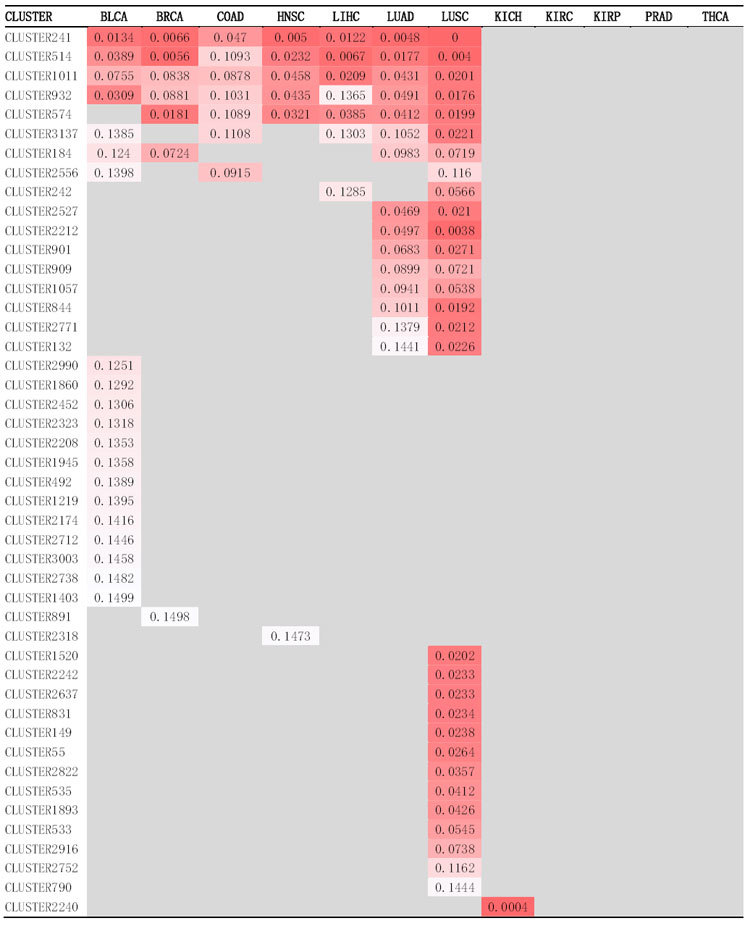
A gene signature denotes a set of genes that are significantly differentially expressed between cancer and normal samples. We call those pathways/gene sets significantly altered in multiple cancer types as cross-cancer gene signatures while those disrupted in just one cancer type as cancer-specific gene signatures. We performed gene set association analysis using all gene sets generated by gene clustering; the results are shown in Supplementary Table S3. We identified 20, 7, 7, 6, 7, 15, 30, and 1 significant gene sets for BLCA, BRCA, COAD, HNSC, LIHC, LUAD, LUSC, and KICH, respectively. No significant associations were found for KIRC, KIRP, PRAD, and THCA. Among 46 significant gene sets, seven are cross-cancer gene signatures whose expression levels were significantly altered in at least four cancer types (Fig. 2), the false discovery rates (FDRs) of these gene sets for each cancer type are shown in Table 2. In order to gain biological insights into these gene sets, we performed three types of pathway enrichment analyses, GO analysis, KEGG analysis, and Pathway Commons analysis, and disease association analysis for genes of each of these gene sets. The results of these analyses are shown in Supplementary Table S4. Interestingly, we found that these seven cross-cancer gene signatures are all closely related to cell cycle regulation, as we expected. Gene set CLUSTER2556 is significant in BLCA, COAD, and LUSC. There are 9 significant gene sets shared by two cancer types. Gene set CLUSTER242 is shared by LIHC and LUSC, and the remaining 8 gene sets are shared by LUAD and LUSC. LUAD and LUSC are more similar to one another than other cancer types possibly because they are both lung cancers.
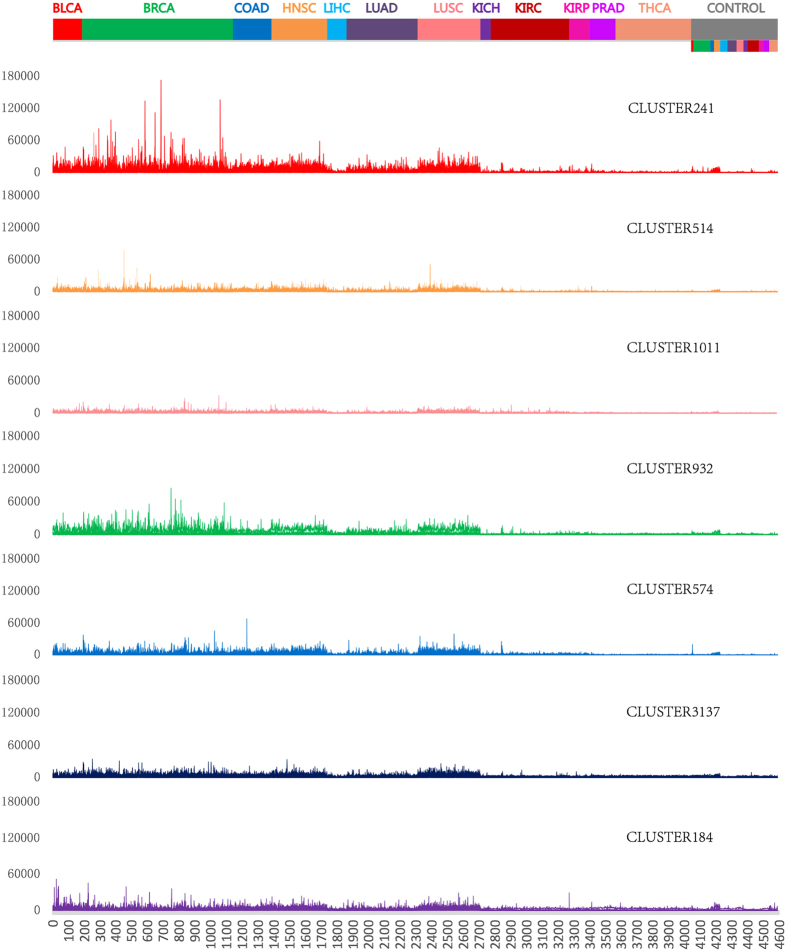
Table 2: Significant gene sets at FDR < 0.15 from 12 types of cancers.
Cross-cancer gene signatures
We identified seven cross-cancer gene signatures: CLUSTER241, CLUSTER514, CLUSTER1011, CLUSTER932, CLUSTER574, CLUSTER3137, and CLUSTER184, that were altered in at least four types of human cancers. All of these signatures are associated with cell cycle regulation.
Cross-cancer gene signature 1 – CLUSTER241.
CLUSTER241 is significantly altered in seven cancer types: BLCA, BRCA, COAD, HNSC, LIHC, LUAD, and LUSC. GO analysis, KEGG analysis, and Pathway Commons analysis indicate that genes in this cluster are enriched in pathways involved in the cell cycle. The top enriched GO biological process, KEGG pathway, and Pathway Commons pathway are M Phase, Cell Cycle, and Mitotic Prometaphase, respectively. The top associated disease is Aneuploidy. Aneuploidy, denoting cells with an abnormal number of chromosomes, is commonly observed in human cancer; it has been recognized as a key characteristic of cancerref. 20ref. 21. This cluster contains 33 genes, several of which have reported roles in cancer. Kinesins have been reported to play critical roles in the initiation and development of human cancersref. 22ref. 23. Marker of proliferation Ki-67 (MKI67) is a prognostic marker for breast cancerref. 24ref. 25. Simultaneous aberration of topoisomerase (DNA) II alpha (TOP2A) and v-erb-b2 avian erythroblastic leukemia viral oncogene homolog 2 (ERBB2/HER2) has been observed in multiple tumor typesref. 26ref. 27.
Cross-cancer gene signature 2 – CLUSTER514.
CLUSTER514 is significantly altered in seven cancer types: BLCA, BRCA, COAD, HNSC, LIHC, LUAD, and LUSC. GO analysis, KEGG analysis, and Pathway Commons analysis indicate that genes in this cluster are enriched in pathways involved in the cell cycle. The top enriched GO biological process, KEGG pathway, and Pathway Commons pathway are Organelle Fission, Cell Cycle, and Cell Cycle, Mitotic, respectively. The top associated disease is Cancer or Viral Infections. This cluster contains 36 genes, of which a lot are prognostic markers for cancer. Enhancer of zeste 2 polycomb repressive complex 2 subunit (EZH2) has been linked to multiple cancersref. 28ref. 29. Aurora kinase A (AURKA) causes chromosome instability by inactivating p53 and contributes to tumorigenesis/carcinogenesisref. 30ref. 31ref. 32. Baculoviral IAP repeat containing 5 (BIRC5) is over-expressed in most human cancers; the microRNA targeting BIRC5 suppresses cell proliferation in triple-negative breast cancer (TNBC) cellsref. 33ref. 34ref. 35. Thymidine Kinase 1 (TK1), which is elevated in the early stages of malignancies, is a universal marker for cancerref. 36ref. 37. Polo-like kinase 1 (PLK1) is overexpressed in many tumor types; it is a target for cancer therapyref. 38ref. 39ref. 40. RAD51 recombinase (RAD51) plays a critical role in DNA Damage Repair and is a potential therapeutic target for cancerref. 41ref. 42. Hyaluronan-mediated motility receptor (HMMR) is correlated to the stemness and tumorigenicity of cancer stem cellsref. 43ref. 44. Cyclin B1 (CCNB1), PDZ binding kinase (PBK), and cyclin-dependent kinase inhibitor 3 (CDKN3) are also prognostic biomarkers for various types of cancerref. 45ref. 46ref. 47ref. 48ref. 49.
Cross-cancer gene signature 3 – CLUSTER1011.
CLUSTER1011 is significantly altered in seven cancer types: BLCA, BRCA, COAD, HNSC, LIHC, LUAD, and LUSC. GO analysis, KEGG analysis, and Pathway Commons analysis indicate that genes in this cluster are enriched in pathways involved in the cell cycle. The top enriched GO biological process, KEGG pathway, and Pathway Commons pathway are Cell Cycle, Cell Cycle, and DNA Replication, respectively. The top associated disease is Fanconi Anemia (FA). The FA proteins are involved in the cell-cycle checkpoint and DNA-repair pathwaysref. 50ref. 51. This cluster contains 19 genes, several of which have been linked to cancer. Mutations in BRCA1 interacting protein C-terminal helicase 1 (BRIP1) have been associated with ovarian cancer and breast cancerref. 52ref. 53ref. 54. The overexpression of KIAA1524/CIP2A have been observed in multiple types of cancerref. 55ref. 56ref. 57. Centromere protein H (CENPH) is a prognostic marker for cancerref. 58ref. 59ref. 60ref. 61.
Cross-cancer gene signature 4 – CLUSTER932.
CLUSTER932 is significantly altered in seven cancer types: BLCA, BRCA, COAD, HNSC, LIHC, LUAD, and LUSC. GO analysis, KEGG analysis, and Pathway Commons analysis indicate that genes in this cluster are enriched in pathways involved in the cell cycle. The top enriched GO biological process, KEGG pathway, and Pathway Commons pathway are Cell Cycle, Cell Cycle, and Cell Cycle, Mitotic, respectively. The top associated disease is Retinoblastoma. This cluster contains 19 genes, many of which have well-known roles in cancer. Cyclin E1 (CCNE1) and cyclin E2 (CCNE2) play critical roles in cell cycle regulation and are potential therapeutic targets in cancerref. 62ref. 63ref. 64. The aberrant expression of cell division cycle 6 (CDC6) has been documented in multiple human cancersref. 65ref. 66ref. 67. E2F transcription factor 7 (E2F7) is interacted with p53, it has been implicated as playing a role in tumorigenesisref. 68ref. 69ref. 70. Ubiquitin-like with PHD and ring finger domains 1 (UHRF1) is an upstream regulator of the Tip60-p53 interaction and it has been linked to liver cancerref. 71.
Cross-cancer gene signature 5 – CLUSTER574.
CLUSTER574 is significantly altered in six cancer types: BRCA, COAD, HNSC, LIHC, LUAD, and LUSC. GO analysis, KEGG analysis, and Pathway Commons analysis indicate that genes in this cluster are enriched in pathways involved in the cell cycle. The top enriched GO biological process, KEGG pathway, and Pathway Commons pathway are Mitotic Cell Cycle, Pyrimidine Metabolism, and Cell Cycle, Mitotic, respectively. The top associated disease is Pancreatic Diseases. This cluster contains 17 genes, several of which have been associated with cancer. Forkhead box M1 (FOXM1) is overexpressed in the majority of human cancers, it has well-known roles in cancerref. 72ref. 73ref. 74. Thymidylate synthetase (TYMS) is considered a prognostic biomarker for cancerref. 75ref. 76. Ribonucleotide reductase M2 (RRM2) is associated with poor survival; it is also implicated in angiogenesisref. 77ref. 78ref. 79. Spindle and kinetochore associated complex subunit 1 (SKA1) has been highlighted as a biomarker in several types of cancersref. 80.
Cross-cancer gene signature 6 – CLUSTER3137.
CLUSTER3137 is significantly altered in five cancer types: BLCA, COAD, LIHC, LUAD, and LUSC. GO analysis, KEGG analysis, and Pathway Commons analysis indicate that genes in this cluster are enriched in pathways involved in the cell cycle. The top enriched GO biological process, KEGG pathway, and Pathway Commons pathway are Cell Cycle Process, Cell Cycle, and Mitotic M-M/G1 Phases, respectively. The top associated disease is Retinoblastoma. This cluster contains 16 genes, several of which have been linked to cancer. S-phase kinase-associated protein 2, E3 ubiquitin protein ligase (SKP2) is a protooncogene in human tumors and is a potential cancer drug targetref. 81ref. 82ref. 83. Ribonucleotide reductase M1 (RRM1) is a prognostic marker for cancerref. 84ref. 85. DNA (cytosine-5-)-methyltransferase 1 (DNMT1) is overexpressed in many cancers and is correlated to the aberrant methylation in human cancer cellsref. 86. The polymorphisms of DNMT1 have been reported to increase breast cancer riskref. 87ref. 88ref. 89.
Cross-cancer gene signature 7 – CLUSTER184.
CLUSTER184 is significantly altered in four cancer types: BLCA, BRCA, LUAD, and LUSC. GO analysis, KEGG analysis, and Pathway Commons analysis indicate that genes in this cluster are enriched in pathways involved in the cell cycle. The top enriched GO biological process, KEGG pathway, and Pathway Commons pathway are M Phase, Oocyte Meiosis, and Cell Cycle, Mitotic, respectively. The top associated disease is Aneuploidy. This cluster contains 24 genes, several of which have been linked to cancer. The aurora kinase B (AURKB) was shown to be overexpressed in many types of cancer cells, and it has been implicated in the carcinogenesis and tumor development processref. 90ref. 91ref. 92. Ubiquitin-conjugating enzyme E2C (UBE2C/UBCH10) has been reported to play a critical role in carcinogenesis and tumor developmentref. 93ref. 94ref. 95.
Although these seven cross-cancer gene signatures in a broad sense are involved in the cell cycle, they may manifest different cellular processes leading to the abnormal cell cycle regulation in malignancy. For example, DNMT1 in CLUSTER3137 is the major enzyme responsible for maintenance of the DNA methylation patternref. 96ref. 97ref. 98. DNMT1 has been reported to be overexpressed in many cancers and to be involved in the epigenetic silencing of tumor suppressor genes in human tumor cellsref. 86. Therefore, the perturbation of CLUSTER3137 might be an epigenetic trigger of tumorigenesis. The deregulation of CLUSTER1011 may reveal the roles of components of the Fanconi anemia/BRCA pathway in human cancers. Increasing evidence shows that FA proteins are involved in the DNA damage responseref. 50ref. 51. In this cluster, except for genes that have established roles in the DNA damage response, such as Fanconi anemia, complementation group D2 (FANCD2)ref. 99, our study also suggests genes, e.g., downstream neighbor of SON (DONSON) and proline/serine-rich coiled-coil 1 (PSRC1), that may have new unrevealed functions in DNA repair since the expression levels of theses genes were up-regulated in accordance with FA proteins and BRIP1 in cancer samples. Altogether, these seven cross-cancer gene signatures can not only deepen and broaden our understanding of the cellular events involving carcinogenesis related to the four phases of the cell cycle, they also reveal many potential novel therapeutic targets that have so far not been linked to cancers but may have unknown roles in cancer biology. Our study can be considered as a starting point, and further investigations (e.g., mutation analysis, survival analysis, and functional analysis) on these genes or clusters may lead to the discovery of novel cancer biomarkers and development of new anticancer therapies.
Gene signatures significantly altered in one type of cancer
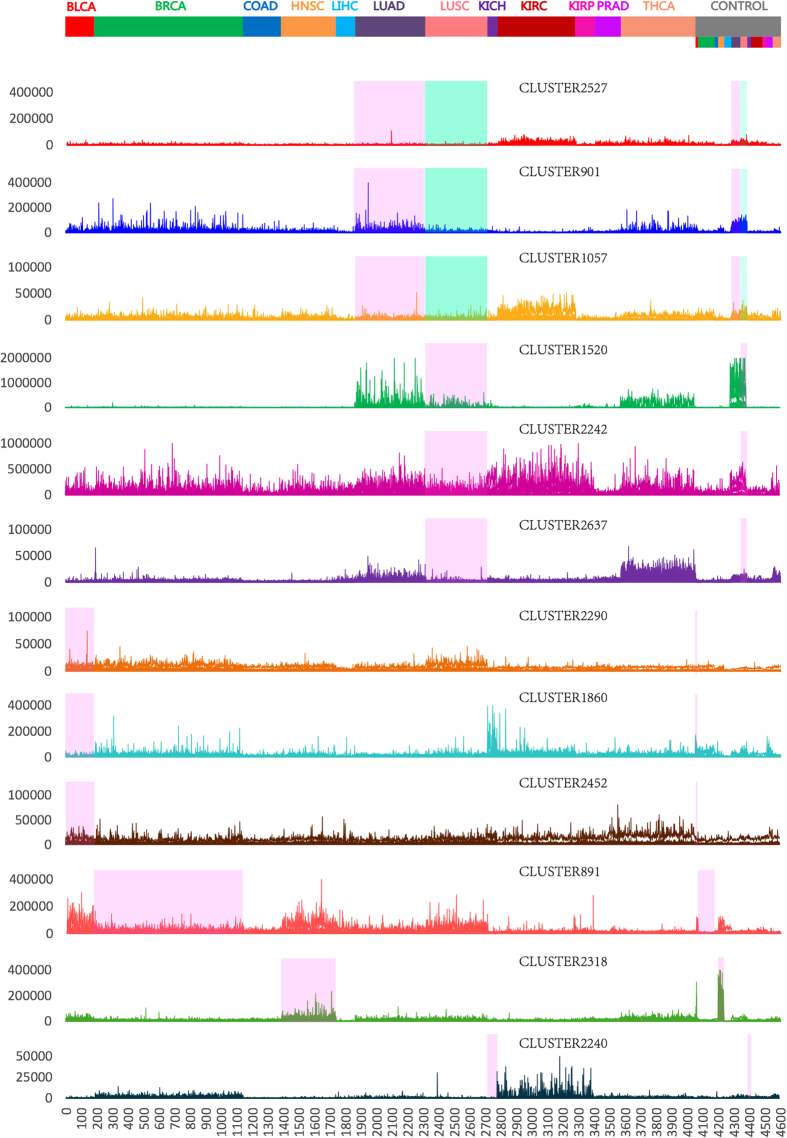
Based on the TCGA cancer data sets we used, we identified 37 gene signatures significantly altered (FDR < 0.15) only in one type of cancer, of which 21 gene signatures are for lung cancers: LUAD and/or LUSC, 13 for BLCA, 1 for BRCA, 1 for HNSC, and 1 for KICH. Figure 3 lists the expression patterns of part of these gene signatures across cancer and normal samples. Among these signature gene sets, several were implicated in relative organ-specific diseases by disease association analysis, and may provide insights into transcriptional aberrations underlying the initiation and progression of a specific cancer type.
Gene signatures for lung cancers.
21 clusters were significantly altered only in one or both of lung cancers, three of which, CLUSTER1520, CLUSTER901 and CLUSTER1057, have been implicated in lung diseases.
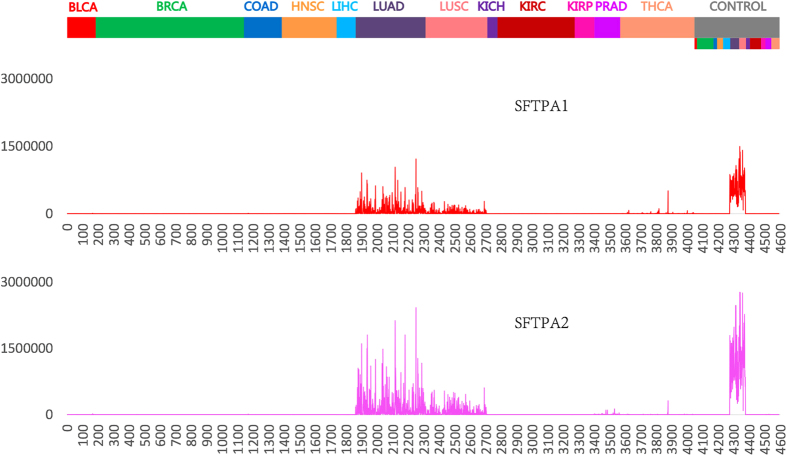
CLUSTER1520 contains 39 genes. Some genes in this cluster have been reported to be associated with lung cancer or other lung diseases (see Table 3 for details). Among them, two genes, SFTPA1 and SFTPA2, encode surfactant protein A (SP-A) that plays a vital role in maintaining normal lung functionref. 100 and have been implicated in various lung diseasesref. 101ref. 102ref. 103ref. 104ref. 105ref. 106ref. 107ref. 108ref. 109. The expression levels of SFTPA1 and SFTPA2 were much higher in lung tissue samples than in any other tissue samples, moreover, these two genes were strikingly down-regulated in lung tumor tissues as compared to the adjacent nontumor tissues (Fig. 4). We thus speculate that the expression changes in these two genes might be an important indicator for lung function abnormalities, and those 39 genes in CLUSTER1520 might form a network underlying the initiation and/or development of lung cancers. It could be valuable to elucidate the possible roles of these genes in lung cancer in an experimental setting.
Table 3: List of lung disease-associated genes in CLUSTER1520.
| Symbol | Full name | Lung diseases |
|---|---|---|
| SFTPA2 | surfactant, pulmonary-associated protein A2 | lung cancerref. 101ref. 102ref. 103ref. 104, acute and chronic lung diseaseref. 105ref. 106 |
| SFTPA1 | surfactant, pulmonary-associated protein A1 | lung cancerref. 103, acute and chronic lung diseaseref. 107ref. 108ref. 109 |
| ROS1 | ROS proto-oncogene 1, receptor tyrosine kinase | lung cancerref. 165ref. 166, |
| ABCA3 | ATP-binding cassette, sub-family A (ABC1), member 3 | pulmonary fibrosisref. 167, respiratory diseaseref. 168ref. 169ref. 170 |
| AQP4 | aquaporin 4 | lung cancerref. 171ref. 172 |
| HHIP | hedgehog interacting protein | lung cancerref. 173, chronic obstructive pulmonary diseaseref. 174, abnormal lung functionref. 175 |
| SLC34A2 | solute carrier family 34, member 2 | pulmonary alveolar microlithiasisref. 176ref. 177 |
| IL6R | interleukin 6 receptor | chronic obstructive pulmonary diseaseref. 178, abnormal lung functionref. 179 |
The top associated disease for CLUSTER901 is Lung Neoplasms (adjP = 0.0006). This cluster contains 32 genes, several of which have been reported to play roles in lung diseases. G protein-coupled receptor, class C, group 5, member A (Gprc5a) protein is detected in the lungs more than in any other tissue; Gprc5a knockout promotes lung inflammation and tumorigenesis in miceref. 110ref. 111ref. 112. Moreover, GPRC5A is down-regulated in the adjacent field and normal bronchial epithelia of patients with chronic obstructive pulmonary disease and non-small-cell lung cancerref. 113ref. 114. Wingless-type MMTV integration site family, member 7A (WNT7A) has been reported to be associated with lung cancerref. 115ref. 116. Claudin 18 (CLDN18) deficiency is related to alveolar barrier dysfunctionref. 117ref. 118. Adrenoceptor beta 2 (ADRB2) is associated with lung function and lung diseasesref. 119ref. 120.
The top associated diseases for CLUSTER1057 are Lung Diseases (adjP = 0.0037), Respiratory Tract Diseases (adjP = 0.0037), and Airway Obstruction (adjP = 0.0037). CLUSTER1057 contains many immunity-associated genes and might contribute to the immune reactions to lung cancers. Among them, interleukin 33 (IL33) has been linked to lung diseasesref. 121ref. 122; interferon (alpha, beta and omega) receptor 2 (IFNAR2) is a prognostic biomarker for lung cancerref. 123; GTPase, IMAP family member 6 (GIMAP6) and member 8 (GIMAP8) were significantly down-regulated in the non-small cell lung cancerref. 124.
Gene signatures for BLCA.
Thirteen clusters were significantly altered only in BLCA, two of which, CLUSTER2174 and CLUSTER1860, have been implicated in bladder abnormalities. The top associated disease for CLUSTER2174 is Urogenital Abnormalities (adjP = 0.0008). This cluster contains 15 genes. Among them, fibroblast growth factor receptor 1 (FGFR1) is a well-known gene that plays a key role in the development of urothelial carcinomasref. 125ref. 126. The top associated disease for CLUSTER1860 is Cystitis (adjP = 3.08e-05). This cluster contains 18 genes. Gap junction protein, gamma 1 (GJC1/CX45) is one of the two most important gap junction proteins in bladder smooth muscle cells and suburothelial myofibroblasts that are essential for the coordination of normal bladder functionref. 127. SPARC-like 1 (SPARCL1) is down-regulated in bladder cancer and prostate cancerref. 128ref. 129.
Gene signatures for BRCA.
CLUSTER891 is significantly altered only in BRCA. The top associated disease is Adenocarcinoma (adjP = 0.0182). This cluster contains 16 genes, two of which have been linked to p53. p53 represses hepatoma-derived growth factor (HDGF), and loss of p53 function contributes to tumorigenesis by elevating HDGF expressionref. 130ref. 131. p53 induces the expression of ferredoxin reductase (FDXR) which sensitizes cells to apoptosisref. 132ref. 133. Syndecan 1 (SDC1) promotes tumor angiogenesis and growthref. 134ref. 135.
Gene signatures for KICH.
CLUSTER2240 is significantly altered only in KICH. The top associated disease for CLUSTER2240 is Ciliary Motility Disorders (adjP = 1.85e-05), and Ciliary dysfunction is a risk factor for both syndromic and isolated kidney cystic diseaseref. 136. This cluster contains 25 genes. Nephronophthisis 1 (NPHP1/NPH1) gene deletion is correlated with nephronophthisisref. 137ref. 138ref. 139ref. 140.
We have shown that DE genes vary dramatically across 12 cancer types. To test whether there exists a more consistent DE pattern at the gene set level, we extracted the top 3% most differentially expressed gene sets from each cancer type, and calculated the number of common DE gene sets between cancer types. The results are shown in the upper triangular matrix in Table 1. We found that the percentage of common gene sets increase compared to the percentage of common genes for most of cancer pairs. This suggests there are common patterns shared by different tumor types, and these patterns can be detected more effectively at the gene set level. These similarities across cancer types shed light on biomarkers that can be used across a range of cancer types and thus have important implications for treatment.
Through genome-wide gene set association analysis of all co-regulated clusters, we identified both cross-cancer gene signatures, which regulate the cell cycle, and cancer-specific gene signatures, which are associated with relative organ/tissue-specific diseases. These partly verified our hypothesis that alterations in cell cycle-associated pathways directly contribute to the initiation and development of cancers, while some organ/tissue-specific pathways can lead to cancers possibly by altering the expression of cell-cycle associated pathways. More functional investigations are necessary for further validating this hypothesis.
Leave-one-out cross validation
Seven gene sets, CLUSTER241, CLUSTER514, CLUSTER1011, CLUSTER932, CLUSTER574, CLUSTER3137, and CLUSTER184, were differentially expressed in at least four of the seven cancer types: BLCA, BRCA, COAD, HNSC, LUAD, and LUSC. We extracted the top two most differentially expressed genes from these gene sets and created a 14-gene signature, including kinesin family member 4A (KIF4A), nucleolar and spindle associated protein 1 (NUSAP1), Holliday junction recognition protein (HJURP), NIMA-related kinase 2 (NEK2), Fanconi anemia, complementation group I (FANCI), denticleless E3 ubiquitin protein ligase homolog (Drosophila) (DTL), UHRF1, flap structure-specific endonuclease 1 (FEN1), IQ motif containing GTPase activating protein 3 (IQGAP3), kinesin family member 20A (KIF20A), tripartite motif containing 59 (TRIM59), centromere protein L (CENPL), chromosome 16 open reading frame 59 (C16orf59), and UBE2C. We employed leave-one-out cross-validation (LOOCV) to assess whether or not this 14-gene signature can be used to differentiate between the normal and cancerous tissue samples of those seven cancer types. Machine learning techniques, for example support vector machines, have been playing a vital role in sample classificationref. 141ref. 142ref. 143ref. 144. LOOCV was performed using SVM-lightref. 145 (http://svmlight.joachims.org/) that is an implementation of support vector machines. The predictive accuracy of LOOCV for each cancer type are shown in Fig. 5. The predictive accuracy is the proportion of the total number of predictions that were correct. We found that most of samples were correctly classified based on the expression levels of these 14 genes, the classification accuracy for BLCA, BRCA, COAD, HNSC, LIHC, LUAD, and LUSC were 92.04%, 96.23%, 91.76%, 90.05%, 88.17%, 94.29%, and 99.10%, respectively.
Validation of the 14-gene cross-cancer signature and a cancer-specific gene signature, CLUSTER1520, on non-TCGA data sets
We have shown that the cancerous and adjacent normal samples from BLCA, BRCA, COAD, HNSC, LIHC, LUAD and LUSC can be precisely classified using the 14-gene cross-cancer signature. To test if the same holds true for other non-TCGA data sources, we downloaded two RNA-Seq data sets, GSE40419ref. 146 and GSE50760ref. 147, and one microarray data set, GSE5364ref. 148, from the Gene Expression Omnibus (GEO: http://www.ncbi.nlm.nih.gov/geo). GSE40419 includes the RNA-Seq expression values for 87 lung adenocarcinomas and 77 adjacent normal tissues, while GSE50760 contains the RNA-Seq expression values of 54 samples (18 primary colorectal cancer, 18 liver metastasis, and 18 normal colon) generated from 18 colorectal cancer patients. We performed LOOCV on these two data sets based on the expression values of the 14-gene cross-cancer signature. We found that the tumor and normal samples were accurately classified, the predictive accuracy for GSE40419 and GSE50760 were 97.14% and 93.33%, respectively. GSE5364 includes 341 samples from multiple solid cancers: 18 lung tumor samples, 12 lung normal samples, 183 breast tumor samples, 13 breast normal samples, 9 colon tumor samples, 9 colon normal samples, 9 liver tumor samples, 8 liver normal samples, 16 oesophagus tumor samples, 13 oesophagus normal samples, 35 thyroid tumor samples, and 16 thyroid normal samples. LOOCV was carried out for tumor and normal samples of each tumor type in this data set, the predictive accuracy for lung, breast, colon, liver, oesophagus, and thyroid samples were 100%, 93.37%, 100%, 100%, 94.12%, and 68.63%, respectively. These results show that our 14-gene cross-cancer signature precisely differentiated between tumor and normal samples for all tumor types in GSE5364 except for those from the thyroid. Interestingly, we here were not able to effectively distinguish tumors from normal samples from the thyroid using this 14-gene cross-cancer signature, and this is consistent with the results from the TCGA data.
We found that CLUSTER1520 is a lung cancer-specific gene signature. In the 548 adjacent normal tissue samples of 12 TCGA cancer types, the expression level of CLUSTER1520 in the lung tissue samples was strikingly higher than any other tissue samples, and the same holds true for tumor samples if excluding THCA tumor samples from the analysis (Fig. 3). Moreover, CLUSTER1520 showed a substantially reduced level of expression in the lung tumor samples as compared to lung normal samples. In order to test if this signature can be used to differentiate lung tumors from other tumors, we divided all cancer samples from 12 TCGA cancer types into two classes: lung cancer samples (LUAD, LUSC) and non-lung cancer samples (BLCA, BRCA, COAD, HNSC, LIHC, KICH, KIRC, KIRP, PRAD, THCA), and performed LOOCV on these two classes of cancer samples using the expression values of CLUSTER1520. The predictive accuracy was 95.68%, namely we very effectively identified lung cancer samples out of a selection of 12 TCGA cancers based on the expression pattern of CLUSTER1520. We also validate that CLUSTER1520 is a lung cancer-specific gene signature on a non-TCGA microarray data set (GSE5364). GSE5364 includes 6 tumor types, and we divided those tumor samples into two classes: lung tumor samples and non-lung tumor samples (breast, colon, liver, oesophagus, thyroid). The predictive accuracy of LOOCV for these two classes of tumor samples was 100%, this demonstrated that lung tumor samples and non-lung tumor samples were accurately classified based on CLUSTER1520. These results show that CLUSTER1520 is a lung cancer-specific gene signature, and genes in this signature are potential targets for developing novel lung cancer therapies.
Gene set association analysis of two non-TCGA data sets
In order to test if the significant gene sets we identified from TCGA data can be validated on non-TCGA data sources, we performed gene set association analysis on two non-TCGA cohorts: a lung adenocarcinoma data set (GSE40419) and a colorectal cancer data set (GSE50760), the results are shown in Supplementary Table S5. For GSE40419, we identified 1 significant gene set (FDR < 0.25), CLUSTER514, which is one of the seven cross-cancer gene signatures. Moreover, we found that 9 out of 10 top gene sets with smallest FDRs were within the significant gene sets identified from TCGA LUAD and/or LUSC data. For GSE50760, we identified five significant gene sets (FDR < 0.25), two of them, CLUSTER2556 and CLUSTER514, were also identified as significant using TCGA COAD data. In the 10 top gene sets with smallest FDRs, 4 overlap with the significant gene sets from TCGA COAD data. These results show that at least part of significant gene sets identified from TCGA data can be validated on these two non-TCGA data sets.
Discussion
In this study, we comprehensively characterized the gene expression alterations of 12 types of cancers at the gene and gene set level. We identified DE genes and gene sets, some DE genes and gene sets are shared by different cancer types while others are only altered in one cancer type. We identified seven cross-cancer gene signatures that are differentially expressed in at least 4 cancer types. These signatures contain not only a number of genes which have established roles in cancers, but also genes that might be potential new biomarkers for cancers. These results reveal the aberrations in cancer transcriptomes and lead to a deeper understanding of the formation and development of human cancers.
Traditionally, we research one cancer type at a time, but there are patterns that can only be detected by making connections across different cancer types. Our results reveal that four gene sets, CLUSTER241, CLUSTER514, CLUSTER1011, and CLUSTER932, are significantly altered across seven cancer types: BLCA, BRCA, COAD, HNSC, LIHC, LUAD, and LUSC (Table 2). These similarities may indicate that there exist common mechanisms underlying the initiation and/or development of human cancers from different organs or different tissues in the same organ. Interestingly, three types of kidney tumors don’t show these patterns. We found that KIRC and KIRP are more similar to each other than KICH since they share 36% of DE genes (Table 1). Studies have shown that KICH is less aggressive than KIRC and KIRPref. 149ref. 150.
Gene expression changes with phenotypic consequences are driven by mutations and epimutations. The driver mutations and epimutations may be scattered in different pathways. We hypothesize that some of these mutations or epimutations may disrupt a pathway responsible for cell cycle regulation that directly drives cells into uncontrolled proliferation, while others may lie within an organ-specific pathway that turn a healthy cell into a cancer cell by altering the expression of cell cycle-associated pathways. We were not able to directly detect which pathways harbor the driver mutations through gene expression analysis, but we observed evidence that at least partially support this hypothesis: 1) aberrations in the cell cycle are a common feature shared by multiple cancer types since all of the cross-cancer gene signatures we identified involved cell cycle processes; 2) we found that some cancer-specific gene signatures contain genes implicated in corresponding organ-specific diseases; 3) each type of cancer has its unique features in terms of their DE profiles. It would be very interesting for future studies to explore the connections between mutational profiles and DE profiles and how gene expression patterns change surrounding driver mutations.
We identified some gene sets that were only significantly altered in one type of cancer. Some of these gene sets may be cancer-specific gene signatures, say CLUSTER1520 and CLUSTER2318, that shed light on the mechanisms underlying cancer-driving abnormalities in a specific organ, while many of them may still represent a cellular process broadly perturbed across cancer types, and the differentiation is just stronger in one cancer type than other cancer types. Therefore, when we look for mechanisms underlying a specific cancer type, we should treat these signatures with caution. It could be a way to reveal cancer-specific events by comparing various tumor types and looking into the differential gene sets between tumor types in the future.
A question arising from this study is how to make connections between the mutational profiles and DE profiles of human cancers. Some genes, for example tumor protein p53 (TP53/p53), phosphatidylinositol-4,5-bisphosphate 3-kinase, catalytic subunit alpha (PIK3CA), and retinoblastoma 1 (RB1), are frequently mutated in a number of cancers and are key genes contributing to tumorigenesisref. 151ref. 152ref. 153. However, among 20530 genes in the BLCA, BRCA, COAD, HNSC, LIHC, LUAD, LUSC, KICH, KIRC, KIRP, PRAD, and THCA datasets, we found that TP53 was ranked at 11834, 14601, 7752, 18515, 17359, 8769, 11116, 14995, 4200, 986, 4776, and 2094, PIK3CA at 16090, 7012, 14799, 4118, 13535, 13228, 6632, 12475, 14634, 17065, 19153, and 18438, RB1 at 15691, 15157, 6836, 16116, 16543, 9168, 19208, 8333, 9565, 4233, 16756, and 11160, respectively (Supplementary Table S1). These genes are not at the top of the DE gene list. One reason could be that mutations in TP53/PIK3CA/RB1 substantially change the expression of its downstream target genes rather than genes harboring themref. 154. For example, the expression levels of two p53 targets, E2F7 and HDGFref. 69ref. 130, are significantly altered across multiple cancer types. These results indicate that cancer-causing genes may only have subtle expression changes, it is thus crucial to measure the total effect of a pathway or integrate mutation analysis into gene expression analysis.
Batch effects in high-throughput data might lead to inaccurate results when dealing with samples from multiple cancer types or data from different sequencing platformsref. 155. In our study, all of the RNA-Seq data we used were from the same sequencing platform and same sequencing center, and this design minimizes the impact of batch effects on our analyses. Second, we clustered genes by their changing tendency in expression over samples, and this can eliminate the impact of batch effects on clustering since these effects are global effects on every gene in a sample. Third, we carried out gene set association analysis for each cancer type independently, thus avoiding the cross-cancer bias from the batch effects. Of course, proper handling of batch effects could improve the cross-platform or cross-cancer consistency when performing analyses on data from different sequencing platforms or different cancer types.
Methods
Overview
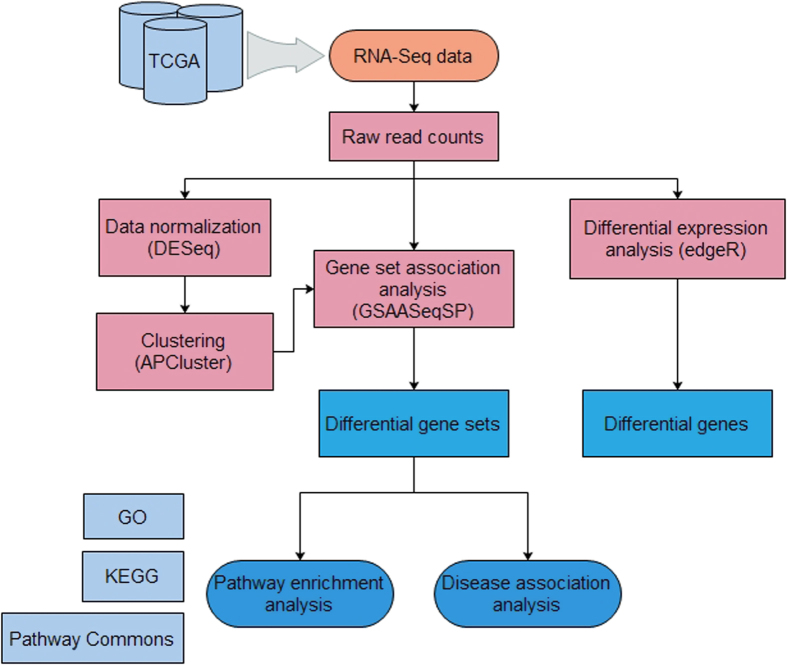
The pipeline of our analysis is illustrated in Fig. 6. The details of each step are described below.
Data sets
Transcriptome data and clinical data were obtained from the TCGA Data Portal (https://tcga-data.nci.nih.gov/tcga/tcgaHome2.jsp). In order to eliminate the heterogeneity introduced by different sequencing platforms, we only downloaded those data in the category of UNC (IlluminaHiSeq_RNASeqV2). We chose 12 cancer types with transcriptome data available for both cancer and normal tissue samples. The two classes of phenotypes we used were “primary tumor” and “solid tissue normal”, namely only those samples in the clinical category of “primary tumor” or “solid tissue normal” were used for this study. The number of cancer and normal samples for each cancer type are listed in Table 4.
Table 4: Number of cancer and normal samples of 12 cancer types.
| Abbreviation | Full Name | Number of Cancers | Number of Normals |
|---|---|---|---|
| BLCA | bladder urothelial carcinoma | 185 | 16 |
| BRCA | breast invasive carcinoma | 955 | 106 |
| COAD | colon adenocarcinoma | 244 | 23 |
| HNSC | head and neck squamous cell carcinoma | 353 | 39 |
| LIHC | liver hepatocellular carcinoma | 123 | 46 |
| LUAD | lung adenocarcinoma | 450 | 58 |
| LUSC | lung squamous cell carcinoma | 398 | 44 |
| KICH | kidney chromophobe | 66 | 25 |
| KIRC | kidney renal clear cell carcinoma | 497 | 72 |
| KIRP | kidney renal papillary cell carcinoma | 127 | 28 |
| PRAD | prostate adenocarcinoma | 166 | 38 |
| THCA | thyroid carcinoma | 479 | 53 |
Differential expression analysis of individual genes
Differential expression analysis of individual genes was carried out using the edgeR Bioconductor packageref. 156 (http://www.bioconductor.org/packages/release/bioc/html/edgeR.html). For each cancer type, we divide samples into two phenotypic groups, primary tumor and solid tissue normal, based on their clinical labels. Raw counts were extracted for these samples and edgeR was employed to find the differentially expressed genes between the two phenotypic groups.
Clustering and gene set association analysis
In order to perform gene set association analysis, we first clustered genes into co-regulated sets based on their expression profiles over all normal samples across 12 cancer types. First, RNA-Seq data were normalized by the DESeq normalization methodref. 157, clustering was then performed using APClusterref. 158ref. 159 (http://www.bioinf.jku.at/software/apcluster/). We used the Pearson correlation coefficient to measure the similarity between genes. Pearson correlation measures the similarity in shape between two expression profiles, so this metric partitions genes into gene groups whose expression levels rise or fall synchronously under varying conditions or in response to a sequence of environment stimuli. We consider genes with coherent changing tendency in expression as co-regulated genes possibly functional in a same pathway. The number of clusters generated by APCluster is largely determined by the input preference, so we set the input preference (q) to 0.98 to obtain precise clusters, namely the expression profiles of genes in the same cluster are highly correlated.
We performed gene set association analysis for each cancer type to identify gene sets/clusters significantly associated with cancers. Gene set association analysis was carried out using GSAASeqSP, a software newly developed by our groupref. 160 (http://gsaa.unc.edu). RNA-Seq raw counts were normalized by the DESeq normalization in GSAASeqSP which is same as that in the DESeq Bioconductor packageref. 157. We chose Signal2Noise for gene-level differential expression analysis and Weighted_KS for gene set association analysis. Gene sets are gene clusters generated by APCluster, and one cluster represents one gene set. Gene sets with less than 15 genes or more than 100 genes were filtered to avoid overly narrow or broad functional categories. In this study, we set the FDR cutoff to 0.15, namely gene sets with FDR < 0.15 were considered to be statistically significantly associated with cancers.
Pathway enrichment analysis and disease association analysis
To gain biological understanding of those gene sets statistically significantly associated with cancers, we carried out pathway enrichment analysis and disease association analysis using WebGestaltref. 161ref. 162 (http://bioinfo.vanderbilt.edu/webgestalt/). We conducted three types of pathway enrichment analyses for genes of significant gene sets: GO analysis, KEGG analysis, and Pathway Commons analysis. GO analysis is to find which GO terms are over-represented in a gene set based on the functional annotation of genes. KEGG analysis and Pathway Commons analysis are to discover pathways enriched in genes in a gene set, the difference between these two analyses is that KEGG analysis is based on the KEGG PATHWAY Databaseref. 163 (http://www.genome.jp/kegg/pathway.html) while Pathway Commons analysis uses pathways collected by Pathway Commonsref. 164. Disease association analysis identifies diseases in which genes in a gene set are over-represented. We adopted the default values for parameters in WebGestalt when performing pathway enrichment analysis and disease association analysis.
Additional Information
How to cite this article: Peng, L. et al. Large-scale RNA-Seq Transcriptome Analysis of 4043 Cancers and 548 Normal Tissue Controls across 12 TCGA Cancer Types. Sci. Rep. 5, 13413; doi: 10.1038/srep13413 (2015).
Supplementary Materials
References
- T. J. Hudson. International network of cancer genome projects.. Nature, 2010. [PubMed]
- L. B. Alexandrov. Signatures of mutational processes in human cancer.. Nature, 2013. [PubMed]
- L. B. Alexandrov, S. Nik-Zainal, D. C. Wedge, P. J. Campbell, M. R. Stratton. Deciphering signatures of mutational processes operative in human cancer.. Cell Rep, 2013. [PubMed]
- D. Tamborero. Comprehensive identification of mutational cancer driver genes across 12 tumor types.. Sci Rep, 2013. [DOI | PubMed]
- O. D. Abaan. The exomes of the NCI-60 panel: a genomic resource for cancer biology and systems pharmacology.. Cancer Res, 2013. [PubMed]
- W. Y. Cheng, T. H. Ou Yang, D. Anastassiou. Biomolecular events in cancer revealed by attractor metagenes.. PLoS Comput Biol, 2013. [DOI | PubMed]
- Z. Wang, M. Gerstein, M. Snyder. RNA-Seq: a revolutionary tool for transcriptomics.. Nat Rev Genet, 2009. [PubMed]
- P. D. Pharoah, A. M. Dunning, B. A. Ponder, D. F. Easton. Association studies for finding cancer-susceptibility genetic variants.. Nat Rev Cancer, 2004. [PubMed]
- K. R. Loeb, L. A. Loeb. Significance of multiple mutations in cancer.. Carcinogenesis, 2000. [PubMed]
- K. Banno. Epimutation and cancer: a new carcinogenic mechanism of Lynch syndrome (Review).. Int J Oncol, 2012. [PubMed]
- I. P. Tomlinson, M. R. Novelli, W. F. Bodmer. The mutation rate and cancer.. Proc Natl Acad Sci USA, 1996. [PubMed]
- M. R. Stratton, P. J. Campbell, P. A. Futreal. The cancer genome.. Nature, 2009. [PubMed]
- G. Gibson. Cancer: Directions for the drivers.. Nature, 2014. [PubMed]
- A. Bashashati. DriverNet: uncovering the impact of somatic driver mutations on transcriptional networks in cancer.. Genome Biol, 2012. [DOI | PubMed]
- P. Khaitovich, W. Enard, M. Lachmann, S. Paabo. Evolution of primate gene expression.. Nat Rev Genet, 2006. [PubMed]
- G. H. Williams, K. Stoeber. The cell cycle and cancer.. J Pathol, 2012. [PubMed]
- K. Collins, T. Jacks, N. P. Pavletich. The cell cycle and cancer.. Proc Natl Acad Sci USA, 1997. [PubMed]
- L. H. Hartwell, M. B. Kastan. Cell cycle control and cancer.. Science, 1994. [PubMed]
- S. Negrini, V. G. Gorgoulis, T. D. Halazonetis. Genomic instability–an evolving hallmark of cancer.. Nat Rev Mol Cell Biol, 2010. [PubMed]
- S. Sen. Aneuploidy and cancer.. Curr Opin Oncol, 2000. [PubMed]
- D. J. Gordon, B. Resio, D. Pellman. Causes and consequences of aneuploidy in cancer.. Nat Rev Genet, 2012. [PubMed]
- P. F. Hung. The motor protein KIF14 inhibits tumor growth and cancer metastasis in lung adenocarcinoma.. PLoS One, 2013. [DOI | PubMed]
- X. Liu, H. Gong, K. Huang. Oncogenic role of kinesin proteins and targeting kinesin therapy.. Cancer Sci, 2013. [PubMed]
- E. de Azambuja. Ki-67 as prognostic marker in early breast cancer: a meta-analysis of published studies involving 12,155 patients.. Br J Cancer, 2007. [PubMed]
- K. Tawfik, B. F. Kimler, M. K. Davis, F. Fan, O. Tawfik. Ki-67 expression in axillary lymph node metastases in breast cancer is prognostically significant.. Hum Pathol, 2013. [PubMed]
- Z. Liang. Analysis of EGFR, HER2, and TOP2A gene status and chromosomal polysomy in gastric adenocarcinoma from Chinese patients.. BMC Cancer, 2008. [DOI | PubMed]
- E. Arriola. Genomic analysis of the HER2/TOP2A amplicon in breast cancer and breast cancer cell lines.. Lab Invest, 2008. [PubMed]
- C. G. Kleer. EZH2 is a marker of aggressive breast cancer and promotes neoplastic transformation of breast epithelial cells.. Proc Natl Acad Sci USA, 2003. [PubMed]
- A. Chase, N. C. Cross. Aberrations of EZH2 in cancer.. Clin Cancer Res, 2011. [PubMed]
- D. F. Lee. Regulation of embryonic and induced pluripotency by aurora kinase-p53 signaling.. Cell Stem Cell, 2012. [PubMed]
- C. H. Chou. Chromosome instability modulated by BMI1-AURKA signaling drives progression in head and neck cancer.. Cancer Res, 2013. [PubMed]
- J. Zhu, J. L. Abbruzzese, J. Izzo, W. N. Hittelman, D. Li. AURKA amplification, chromosome instability, and centrosome abnormality in human pancreatic carcinoma cells.. Cancer Genet Cytogenet, 2005. [PubMed]
- A. Nassar, D. Lawson, G. Cotsonis, C. Cohen. Survivin and caspase-3 expression in breast cancer: correlation with prognostic parameters, proliferation, angiogenesis, and outcome.. Appl Immunohistochem Mol Morphol, 2008. [PubMed]
- R. Boidot. The expression of BIRC5 is correlated with loss of specific chromosomal regions in breast carcinomas.. Genes Chromosomes Cancer, 2008. [PubMed]
- C. Wang, X. Zheng, C. Shen, Y. Shi. MicroRNA-203 suppresses cell proliferation and migration by targeting BIRC5 and LASP1 in human triple-negative breast cancer cells.. J Exp Clin Cancer Res, 2012. [DOI | PubMed]
- M. M. Alegre, R. A. Robison, K. L. O’Neill. Thymidine Kinase 1: A Universal Marker for Cancer.. Cancer and Clinical Oncology, 2013
- M. M. Alegre, R. A. Robison, K. L. O’Neill. Thymidine kinase 1 upregulation is an early event in breast tumor formation.. J Oncol, 2012. [DOI | PubMed]
- Y. Degenhardt, T. Lampkin. Targeting Polo-like kinase in cancer therapy.. Clin Cancer Res, 2010. [PubMed]
- L. Weiss, T. Efferth. Polo-like kinase 1 as target for cancer therapy.. Exp Hematol Oncol, 2012. [DOI | PubMed]
- K. Hu, J. H. Law, A. Fotovati, S. E. Dunn. Small interfering RNA library screen identified polo-like kinase-1 (PLK1) as a potential therapeutic target for breast cancer that uniquely eliminates tumor-initiating cells.. Breast Cancer Res, 2012. [DOI | PubMed]
- C. J. Lord, A. Ashworth. RAD51, BRCA2 and DNA repair: a partial resolution.. Nat Struct Mol Biol, 2007. [PubMed]
- N. S. Nagathihalli, G. Nagaraju. RAD51 as a potential biomarker and therapeutic target for pancreatic cancer.. Biochim Biophys Acta, 2011. [PubMed]
- J. Tilghman. HMMR maintains the stemness and tumorigenicity of glioblastoma stem-like cells.. Cancer Res, 2014. [PubMed]
- M. A. Pujana. Network modeling links breast cancer susceptibility and centrosome dysfunction.. Nat Genet, 2007. [PubMed]
- T. Suzuki. Nuclear cyclin B1 in human breast carcinoma as a potent prognostic factor.. Cancer Sci, 2007. [PubMed]
- K. A. Hassan. Clinical significance of cyclin B1 protein expression in squamous cell carcinoma of the tongue.. Clin Cancer Res, 2001. [PubMed]
- F. Hu. PBK/TOPK interacts with the DBD domain of tumor suppressor p53 and modulates expression of transcriptional targets including p21.. Oncogene, 2010. [PubMed]
- M. C. Shih. TOPK/PBK promotes cell migration via modulation of the PI3K/PTEN/AKT pathway and is associated with poor prognosis in lung cancer.. Oncogene, 2012. [PubMed]
- T. Li, H. Xue, Y. Guo, K. Guo. CDKN3 is an independent prognostic factor and promotes ovarian carcinoma cell proliferation in ovarian cancer.. Oncol Rep, 2014. [PubMed]
- A. D. D’Andrea, M. Grompe. The Fanconi anaemia/BRCA pathway.. Nat Rev Cancer, 2003. [PubMed]
- W. Wang. Emergence of a DNA-damage response network consisting of Fanconi anaemia and BRCA proteins.. Nat Rev Genet, 2007. [PubMed]
- T. Rafnar. Mutations in BRIP1 confer high risk of ovarian cancer.. Nat Genet, 2011. [PubMed]
- S. Seal. Truncating mutations in the Fanconi anemia J gene BRIP1 are low-penetrance breast cancer susceptibility alleles.. Nat Genet, 2006. [PubMed]
- A. De Nicolo. A novel breast cancer-associated BRIP1 (FANCJ/BACH1) germ-line mutation impairs protein stability and function.. Clin Cancer Res, 2008. [PubMed]
- J. S. Kim, E. J. Kim, J. S. Oh, I. C. Park, S. G. Hwang. CIP2A modulates cell-cycle progression in human cancer cells by regulating the stability and activity of Plk1.. Cancer Res, 2013. [PubMed]
- N. Liu. Overexpression of CIP2A is an independent prognostic indicator in nasopharyngeal carcinoma and its depletion suppresses cell proliferation and tumor growth.. Mol Cancer, 2014. [DOI | PubMed]
- M. H. Vaarala, M. R. Vaisanen, A. Ristimaki. CIP2A expression is increased in prostate cancer.. J Exp Clin Cancer Res, 2010. [DOI | PubMed]
- X. Zhao. Interruption of cenph causes mitotic failure and embryonic death, and its haploinsufficiency suppresses cancer in zebrafish.. J Biol Chem, 2010. [PubMed]
- W. T. Liao. Centromere protein H is a novel prognostic marker for nasopharyngeal carcinoma progression and overall patient survival.. Clin Cancer Res, 2007. [PubMed]
- W. T. Liao. Centromere protein H is a novel prognostic marker for human nonsmall cell lung cancer progression and overall patient survival.. Cancer, 2009. [PubMed]
- W. T. Liao. Overexpression of centromere protein H is significantly associated with breast cancer progression and overall patient survival.. Chin J Cancer, 2011. [PubMed]
- P. Potemski. Cyclin E expression in breast cancer correlates with negative steroid receptor status, HER2 expression, tumor grade and proliferation.. J Exp Clin Cancer Res, 2006. [PubMed]
- A. M. Sieuwerts. Which cyclin E prevails as prognostic marker for breast cancer? Results from a retrospective study involving 635 lymph node-negative breast cancer patients.. Clin Cancer Res, 2006. [PubMed]
- N. Nakayama. Gene amplification CCNE1 is related to poor survival and potential therapeutic target in ovarian cancer.. Cancer, 2010. [PubMed]
- S. Gonzalez. Oncogenic activity of Cdc6 through repression of the INK4/ARF locus.. Nature, 2006. [PubMed]
- Y. Liu, Z. Gong, L. Sun, X. Li. FOXM1 and androgen receptor co-regulate CDC6 gene transcription and DNA replication in prostate cancer cells.. Biochim Biophys Acta, 2014. [PubMed]
- L. D. Robles. Down-regulation of Cdc6, a cell cycle regulatory gene, in prostate cancer.. J Biol Chem, 2002. [PubMed]
- L. Endo-Munoz. E2F7 can regulate proliferation, differentiation, and apoptotic responses in human keratinocytes: implications for cutaneous squamous cell carcinoma formation.. Cancer Res, 2009. [PubMed]
- L. A. Carvajal, P. J. Hamard, C. Tonnessen, J. J. Manfredi. E2F7, a novel target, is up-regulated by p53 and mediates DNA damage-dependent transcriptional repression.. Genes Dev, 2012. [PubMed]
- H. Z. Chen, S. Y. Tsai, G. Leone. Emerging roles of E2Fs in cancer: an exit from cell cycle control.. Nat Rev Cancer, 2009. [PubMed]
- R. Mudbhary. UHRF1 overexpression drives DNA hypomethylation and hepatocellular carcinoma.. Cancer Cell, 2014. [PubMed]
- P. Raychaudhuri, H. J. Park. FoxM1: a master regulator of tumor metastasis.. Cancer Res, 2011. [PubMed]
- I. Lokody. Signalling: FOXM1 and CENPF: co-pilots driving prostate cancer.. Nat Rev Cancer, 2014. [PubMed]
- M. Halasi, A. L. Gartel. Targeting FOXM1 in cancer.. Biochem Pharmacol, 2013. [PubMed]
- A. Koumarianou. Prognostic Markers in Early-stage Colorectal Cancer: Significance of TYMS mRNA Expression.. Anticancer Res, 2014. [PubMed]
- L. C. Conradi. Thymidylate synthase as a prognostic biomarker for locally advanced rectal cancer after multimodal treatment.. Ann Surg Oncol, 2011. [PubMed]
- N. Y. Hsu. Expression status of ribonucleotide reductase small subunits hRRM2/p53R2 as prognostic biomarkers in stage I and II non-small cell lung cancer.. Anticancer Res, 2011. [PubMed]
- N. Putluri. Pathway-centric integrative analysis identifies RRM2 as a prognostic marker in breast cancer associated with poor survival and tamoxifen resistance.. Neoplasia, 2014. [PubMed]
- K. Zhang. Overexpression of RRM2 decreases thrombspondin-1 and increases VEGF production in human cancer cells in vitro and in vivo: implication of RRM2 in angiogenesis.. Mol Cancer, 2009. [DOI | PubMed]
- W. Sun, L. Yao, B. Jiang, L. Guo, Q. Wang. Spindle and kinetochore-associated protein 1 is overexpressed in gastric cancer and modulates cell growth.. Mol Cell Biochem, 2014. [PubMed]
- M. Gstaiger. Skp2 is oncogenic and overexpressed in human cancers.. Proc Natl Acad Sci USA, 2001. [PubMed]
- H. K. Lin. Skp2 targeting suppresses tumorigenesis by Arf-p53-independent cellular senescence.. Nature, 2010. [PubMed]
- Z. Wang. Skp2: a novel potential therapeutic target for prostate cancer.. Biochim Biophys Acta, 2012. [PubMed]
- L. P. Jordheim, P. Seve, O. Tredan, C. Dumontet. The ribonucleotide reductase large subunit (RRM1) as a predictive factor in patients with cancer.. Lancet Oncol, 2011. [PubMed]
- P. Ceppi. ERCC1 and RRM1 gene expressions but not EGFR are predictive of shorter survival in advanced non-small-cell lung cancer treated with cisplatin and gemcitabine.. Ann Oncol, 2006. [PubMed]
- S. Agarwal. Mahanine restores RASSF1A expression by down-regulating DNMT1 and DNMT3B in prostate cancer cells.. Mol Cancer, 2013. [DOI | PubMed]
- M. F. Robert. DNMT1 is required to maintain CpG methylation and aberrant gene silencing in human cancer cells.. Nat Genet, 2003. [PubMed]
- A. Li, N. Omura, S. M. Hong, M. Goggins. Pancreatic cancer DNMT1 expression and sensitivity to DNMT1 inhibitors.. Cancer Biol Ther, 2010. [PubMed]
- K. Kullmann, M. Deryal, M. F. Ong, W. Schmidt, U. Mahlknecht. DNMT1 genetic polymorphisms affect breast cancer risk in the central European Caucasian population.. Clin Epigenetics, 2013. [DOI | PubMed]
- J. den Hollander. Aurora kinases A and B are up-regulated by Myc and are essential for maintenance of the malignant state.. Blood, 2010. [PubMed]
- O. Morozova. System-level analysis of neuroblastoma tumor-initiating cells implicates AURKB as a novel drug target for neuroblastoma.. Clin Cancer Res, 2010. [PubMed]
- M. K. Addepalli. RNAi-mediated knockdown of AURKB and EGFR shows enhanced therapeutic efficacy in prostate tumor regression.. Gene Ther, 2010. [PubMed]
- K. W. Wagner. Overexpression, genomic amplification and therapeutic potential of inhibiting the UbcH10 ubiquitin conjugase in human carcinomas of diverse anatomic origin.. Oncogene, 2004. [PubMed]
- P. Pallante. UbcH10 overexpression in human lung carcinomas and its correlation with EGFR and p53 mutational status.. Eur J Cancer, 2013. [PubMed]
- T. Fujita. Clinicopathological relevance of UbcH10 in breast cancer.. Cancer Sci, 2009. [PubMed]
- I. Rhee. DNMT1 and DNMT3b cooperate to silence genes in human cancer cells.. Nature, 2002. [PubMed]
- D. Subramaniam, R. Thombre, A. Dhar, S. Anant. DNA methyltransferases: a novel target for prevention and therapy.. Front Oncol, 2014. [DOI | PubMed]
- K. D. Robertson. DNA methylation, methyltransferases, and cancer.. Oncogene, 2001. [PubMed]
- I. Garcia-Higuera. Interaction of the Fanconi anemia proteins and BRCA1 in a common pathway.. Mol Cell, 2001. [PubMed]
- P. Silveyra, S. L. DiAngelo, J. Floros. An 11-nt sequence polymorphism at the 3’UTR of human SFTPA1 and SFTPA2 gene variants differentially affect gene expression levels and miRNA regulation in cell culture.. Am J Physiol Lung Cell Mol Physiol, 2014. [PubMed]
- M. Grageda, P. Silveyra, N. J. Thomas, S. L. DiAngelo, J. Floros. DNA methylation profile and expression of surfactant protein A2 gene in lung cancer.. Exp Lung Res, 2015. [PubMed]
- Y. Wang. Genetic defects in surfactant protein A2 are associated with pulmonary fibrosis and lung cancer.. Am J Hum Genet, 2009. [PubMed]
- Z. Lin. DNA methylation markers of surfactant proteins in lung cancer.. Int J Oncol, 2007. [PubMed]
- M. Maitra, C. A. Cano, C. K. Garcia. Mutant surfactant A2 proteins associated with familial pulmonary fibrosis and lung cancer induce TGF-beta1 secretion.. Proc Natl Acad Sci USA, 2012. [PubMed]
- M. Maitra, Y. Wang, R. D. Gerard, C. R. Mendelson, C. K. Garcia. Surfactant protein A2 mutations associated with pulmonary fibrosis lead to protein instability and endoplasmic reticulum stress.. J Biol Chem, 2010. [PubMed]
- E. H. Choi, M. Ehrmantraut, C. B. Foster, J. Moss, S. J. Chanock. Association of common haplotypes of surfactant protein A1 and A2 (SFTPA1 and SFTPA2) genes with severity of lung disease in cystic fibrosis.. Pediatr Pulmonol, 2006. [PubMed]
- S. Heinrich, D. Hartl, M. Griese. Surfactant protein A–from genes to human lung diseases.. Curr Med Chem, 2006. [PubMed]
- Y. Zhang. Identification and examination of a novel 9-bp insert/deletion polymorphism on porcine SFTPA1 exon 2 associated with acute lung injury using an oleic acid-acute lung injury model.. Anim Sci J, 2015. [PubMed]
- P. Silveyra, J. Floros. Genetic variant associations of human SP-A and SP-D with acute and chronic lung injury.. Front Biosci (Landmark Ed), 2012. [PubMed]
- J. Deng. Knockout of the tumor suppressor gene Gprc5a in mice leads to NF-kappaB activation in airway epithelium and promotes lung inflammation and tumorigenesis.. Cancer Prev Res (Phila), 2010. [PubMed]
- P. Barta. Enhancement of lung tumorigenesis in a Gprc5a Knockout mouse by chronic extrinsic airway inflammation.. Mol Cancer, 2012. [DOI | PubMed]
- Y. Chen. Gprc5a deletion enhances the transformed phenotype in normal and malignant lung epithelial cells by eliciting persistent Stat3 signaling induced by autocrine leukemia inhibitory factor.. Cancer Res, 2010. [PubMed]
- J. Fujimoto. G-protein coupled receptor family C, group 5, member A (GPRC5A) expression is decreased in the adjacent field and normal bronchial epithelia of patients with chronic obstructive pulmonary disease and non-small-cell lung cancer.. J Thorac Oncol, 2012. [PubMed]
- H. Kadara. A Gprc5a tumor suppressor loss of expression signature is conserved, prevalent, and associated with survival in human lung adenocarcinomas.. Neoplasia, 2010. [PubMed]
- T. Ohira. WNT7a induces E-cadherin in lung cancer cells.. Proc Natl Acad Sci U S A, 2003. [PubMed]
- M. A. Tennis, M. M. Vanscoyk, L. A. Wilson, N. Kelley, R. A. Winn. Methylation of Wnt7a is modulated by DNMT1 and cigarette smoke condensate in non-small cell lung cancer.. PLoS One, 2012. [DOI | PubMed]
- M. J. LaFemina. Claudin-18 deficiency results in alveolar barrier dysfunction and impaired alveologenesis in mice.. Am J Respir Cell Mol Biol, 2014. [PubMed]
- P. Micke. Aberrantly activated claudin 6 and 18.2 as potential therapy targets in non-small-cell lung cancer.. Int J Cancer, 2014. [PubMed]
- T. M. Torjussen. Childhood lung function and the association with beta2-adrenergic receptor haplotypes.. Acta Paediatr, 2013. [PubMed]
- F. A. Marson, C. S. Bertuzzo, A. F. Ribeiro, J. D. Ribeiro. Polymorphisms in ADRB2 gene can modulate the response to bronchodilators and the severity of cystic fibrosis.. BMC Pulm Med, 2012. [DOI | PubMed]
- D. E. Byers. Long-term IL-33-producing epithelial progenitor cells in chronic obstructive lung disease.. J Clin Invest, 2013. [PubMed]
- D. Li. IL-33 promotes ST2-dependent lung fibrosis by the induction of alternatively activated macrophages and innate lymphoid cells in mice.. J Allergy Clin Immunol, 2014. [PubMed]
- S. Tanaka. Interferon (alpha, beta and omega) receptor 2 is a prognostic biomarker for lung cancer.. Pathobiology, 2012. [PubMed]
- Y. M. Shiao. Dysregulation of GIMAP genes in non-small cell lung cancer.. Lung Cancer, 2008. [PubMed]
- E. di Martino, D. C. Tomlinson, M. A. Knowles. A Decade of FGF Receptor Research in Bladder Cancer: Past, Present, and Future Challenges.. Adv Urol, 2012. [DOI | PubMed]
- F. R. Lamont. Small molecule FGF receptor inhibitors block FGFR-dependent urothelial carcinoma growth in vitro and in vivo.. Br J Cancer, 2011. [PubMed]
- M. Heinrich, A. Oberbach, N. Schlichting, J. U. Stolzenburg, J. Neuhaus. Cytokine effects on gap junction communication and connexin expression in human bladder smooth muscle cells and suburothelial myofibroblasts.. PLoS One, 2011. [DOI | PubMed]
- A. Zaravinos, G. I. Lambrou, I. Boulalas, D. Delakas, D. A. Spandidos. Identification of common differentially expressed genes in urinary bladder cancer.. PLoS One, 2011. [DOI | PubMed]
- P. J. Hurley. Secreted protein, acidic and rich in cysteine-like 1 (SPARCL1) is down regulated in aggressive prostate cancers and is prognostic for poor clinical outcome.. Proc Natl Acad Sci USA, 2012. [PubMed]
- Y. Sasaki. p53 negatively regulates the hepatoma growth factor HDGF.. Cancer Res, 2011. [PubMed]
- S. C. Chen. Hepatoma-derived growth factor regulates breast cancer cell invasion by modulating epithelial–mesenchymal transition.. J Pathol, 2012. [PubMed]
- G. Liu, X. Chen. The ferredoxin reductase gene is regulated by the p53 family and sensitizes cells to oxidative stress-induced apoptosis.. Oncogene, 2002. [PubMed]
- M. Lacroix, R. A. Toillon, G. Leclercq. p53 and breast cancer, an update.. Endocr Relat Cancer, 2006. [PubMed]
- N. Yang, R. Mosher, S. Seo, D. Beebe, A. Friedl. Syndecan-1 in breast cancer stroma fibroblasts regulates extracellular matrix fiber organization and carcinoma cell motility.. Am J Pathol, 2011. [PubMed]
- T. Maeda, J. Desouky, A. Friedl. Syndecan-1 expression by stromal fibroblasts promotes breast carcinoma growth in vivo and stimulates tumor angiogenesis.. Oncogene, 2006. [PubMed]
- C. Gascue, N. Katsanis, J. L. Badano. Cystic diseases of the kidney: ciliary dysfunction and cystogenic mechanisms.. Pediatr Nephrol, 2011. [PubMed]
- G. Bollee. Nephronophthisis related to homozygous NPHP1 gene deletion as a cause of chronic renal failure in adults.. Nephrol Dial Transplant, 2006. [PubMed]
- S. Saunier. Characterization of the NPHP1 locus: mutational mechanism involved in deletions in familial juvenile nephronophthisis.. Am J Hum Genet, 2000. [PubMed]
- M. Konrad. Large homozygous deletions of the 2q13 region are a major cause of juvenile nephronophthisis.. Hum Mol Genet, 1996. [PubMed]
- M. A. Parisi. The NPHP1 gene deletion associated with juvenile nephronophthisis is present in a subset of individuals with Joubert syndrome.. Am J Hum Genet, 2004. [PubMed]
- T. S. Furey. Support vector machine classification and validation of cancer tissue samples using microarray expression data.. Bioinformatics, 2000. [PubMed]
- C. Zhang, X. Lu, X. Zhang. Significance of gene ranking for classification of microarray samples.. IEEE/ACM Trans Comput Biol Bioinform, 2006. [PubMed]
- Y. Saeys, I. Inza, P. Larranaga. A review of feature selection techniques in bioinformatics.. Bioinformatics, 2007. [PubMed]
- A. Sharma, S. Imoto, S. Miyano. A top-r feature selection algorithm for microarray gene expression data.. IEEE/ACM Trans Comput Biol Bioinform, 2012. [PubMed]
- T. Joachims, B. Schölkopf, C. Burges, A. Smola. Making large-Scale SVM Learning Practical. in. Advances in Kernel Methods – Support Vector Learning (eds., 1999
- J. S. Seo. The transcriptional landscape and mutational profile of lung adenocarcinoma.. Genome Res, 2012. [PubMed]
- S. K. Kim. A nineteen gene-based risk score classifier predicts prognosis of colorectal cancer patients.. Mol Oncol, 2014. [PubMed]
- K. Yu. A precisely regulated gene expression cassette potently modulates metastasis and survival in multiple solid cancers.. PLoS Genet, 2008. [DOI | PubMed]
- S. Steffens. Clinical behavior of chromophobe renal cell carcinoma is less aggressive than that of clear cell renal cell carcinoma, independent of Fuhrman grade or tumor size.. Virchows Arch, 2014. [PubMed]
- T. Onishi, Y. Ohishi, H. Goto, M. Suzuki, Y. Miyazawa. Papillary renal cell carcinoma: clinicopathological characteristics and evaluation of prognosis in 42 patients.. BJU Int, 1999. [PubMed]
- P. A. Muller, K. H. Vousden. p53 mutations in cancer.. Nat Cell Biol, 2013. [PubMed]
- B. Karakas, K. E. Bachman, B. H. Park. Mutation of the PIK3CA oncogene in human cancers.. Br J Cancer, 2006. [PubMed]
- R. A. Kleinerman. Hereditary retinoblastoma and risk of lung cancer.. J Natl Cancer Inst, 2000. [PubMed]
- D. Menendez, A. Inga, M. A. Resnick. The expanding universe of p53 targets.. Nat Rev Cancer, 2009. [PubMed]
- J. T. Leek. Tackling the widespread and critical impact of batch effects in high-throughput data.. Nat Rev Genet, 2010. [PubMed]
- M. D. Robinson, D. J. McCarthy, G. K. Smyth. edgeR: a Bioconductor package for differential expression analysis of digital gene expression data.. Bioinformatics, 2010. [PubMed]
- S. Anders, W. Huber. Differential expression analysis for sequence count data.. Genome Biol, 2010. [DOI | PubMed]
- U. Bodenhofer, A. Kothmeier, S. Hochreiter. APCluster: an R package for affinity propagation clustering.. Bioinformatics, 2011. [PubMed]
- B. J. Frey, D. Dueck. Clustering by passing messages between data points.. Science, 2007. [PubMed]
- Q. Xiong, S. Mukherjee, T. S. Furey. GSAASeqSP: a toolset for gene set association analysis of RNA-Seq data.. Sci Rep, 2014. [DOI | PubMed]
- B. Zhang, S. Kirov, J. Snoddy. WebGestalt: an integrated system for exploring gene sets in various biological contexts.. Nucleic Acids Res, 2005. [PubMed]
- J. Wang, D. Duncan, Z. Shi, B. Zhang. WEB-based GEne SeT AnaLysis Toolkit (WebGestalt): update 2013.. Nucleic Acids Res, 2013. [PubMed]
- M. Kanehisa. Data, information, knowledge and principle: back to metabolism in KEGG.. Nucleic Acids Res, 2014. [PubMed]
- E. G. Cerami. Pathway Commons, a web resource for biological pathway data.. Nucleic Acids Res, 2011. [PubMed]
- D. Killock. Lung cancer: alternative rearrangements–targeting ROS1 in NSCLC.. Nat Rev Clin Oncol, 2014. [DOI | PubMed]
- K. Bergethon. ROS1 rearrangements define a unique molecular class of lung cancers.. J Clin Oncol, 2012. [PubMed]
- I. Campo. A large kindred of pulmonary fibrosis associated with a novel ABCA3 gene variant.. Respir Res, 2014. [DOI | PubMed]
- J. A. Wambach. Genotype-phenotype correlations for infants and children with ABCA3 deficiency.. Am J Respir Crit Care Med, 2014. [PubMed]
- A. Agrawal. An intronic ABCA3 mutation that is responsible for respiratory disease.. Pediatr Res, 2012. [PubMed]
- W. A. Gower. Fatal familial lung disease caused by ABCA3 deficiency without identified ABCA3 mutations.. J Pediatr, 2010. [PubMed]
- Y. Xie. Aquaporin 1 and aquaporin 4 are involved in invasion of lung cancer cells.. Clin Lab, 2012. [PubMed]
- A. Warth. Loss of aquaporin-4 expression and putative function in non-small cell lung cancer.. BMC Cancer, 2011. [DOI | PubMed]
- Q. Yang. STAT3 activation and aberrant ligand-dependent sonic hedgehog signaling in human pulmonary adenocarcinoma.. Exp Mol Pathol, 2012. [PubMed]
- X. Zhou. Identification of a chronic obstructive pulmonary disease genetic determinant that regulates HHIP.. Hum Mol Genet, 2012. [PubMed]
- X. Li. Importance of hedgehog interacting protein and other lung function genes in asthma.. J Allergy Clin Immunol, 2011. [PubMed]
- A. L. Jonsson, U. Simonsen, O. Hilberg, E. Bendstrup. Pulmonary alveolar microlithiasis: two case reports and review of the literature.. Eur Respir Rev, 2012. [PubMed]
- F. A. Ferreira Francisco, J. L. Pereira e Silva, B. Hochhegger, G. Zanetti, E. Marchiori. Pulmonary alveolar microlithiasis. State-of-the-art review.. Respir Med, 2013. [PubMed]
- J. S. Edmiston. Gene expression profiling of peripheral blood leukocytes identifies potential novel biomarkers of chronic obstructive pulmonary disease in current and former smokers.. Biomarkers, 2010. [PubMed]
- G. A. Hawkins. The IL6R variation Asp(358)Ala is a potential modifier of lung function in subjects with asthma.. J Allergy Clin Immunol, 2012. [PubMed]